Bitcoin Cash Technical Analysis: BCH/USD has broken out of near-term support, but price action is muted, another big move potentially pending
- Bitcoin Cash price on Friday is hit once again by the market bears, as has been the case this week, down 4% on the day.
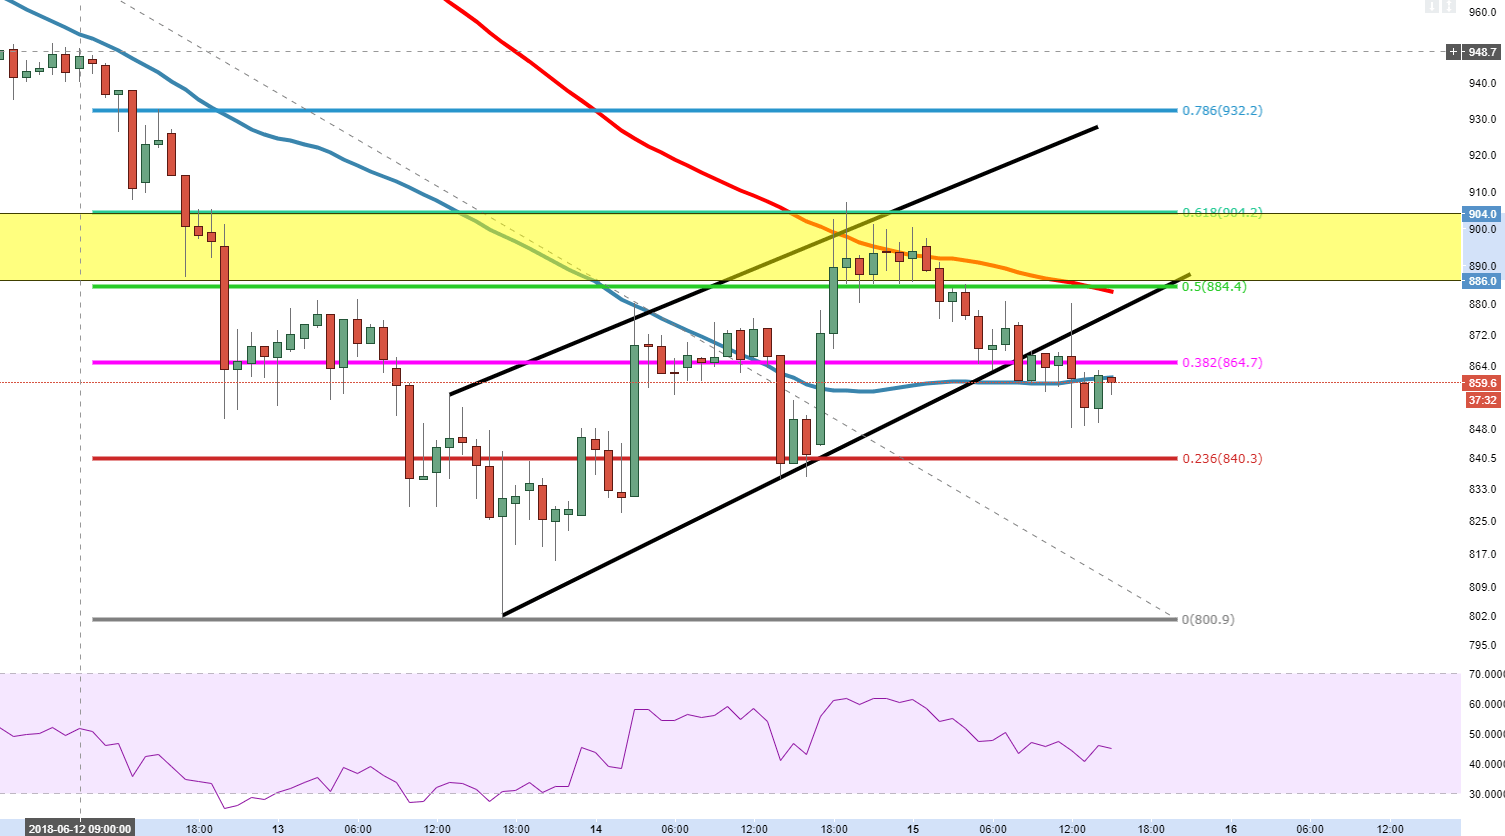
- BCH/USD breached a supporting channel pattern, however a lack of movement since the break.
- It will be the second consecutive week of losses for Bitcoin Cash, dropping from $1200 down to current levels.

BCH/USD 60-minute chart
Spot rate: 97.24
Relative change: -3.55%
High: 100.85
Low: 96.64
Trend: Bearish
Support 1: 850.0, (support on 60-minute chart).
Support 2: 840.0, 23.6% Fibonacci
Support 3: 801.0, 13th June low.
Resistance 1: 861.6, 50MA.
Resistance 2: 865.0, 38.2% Fibonacci.
Resistance 3: 878.5, underneath channel pattern.
Author

Ken Chigbo
Independent Analyst
Ken has over 8 years exposure to the financial markets. He started his career as an analyst, covering a variety of asset classes; forex, fixed income, commodities and equities.
More from Ken Chigbo