Bitcoin Cash Technical Analysis: BCH/USD $200 must hold or face big selling
- Bitcoin Cash price is trading in the red, with losses of 0.10% in the second half of the session.
- BCH/USD is running at towards two consecutive weeks in the red, remaining around seven-month lows.
- The critical support via the weekly is eyed at $200, a breach could be damaging.

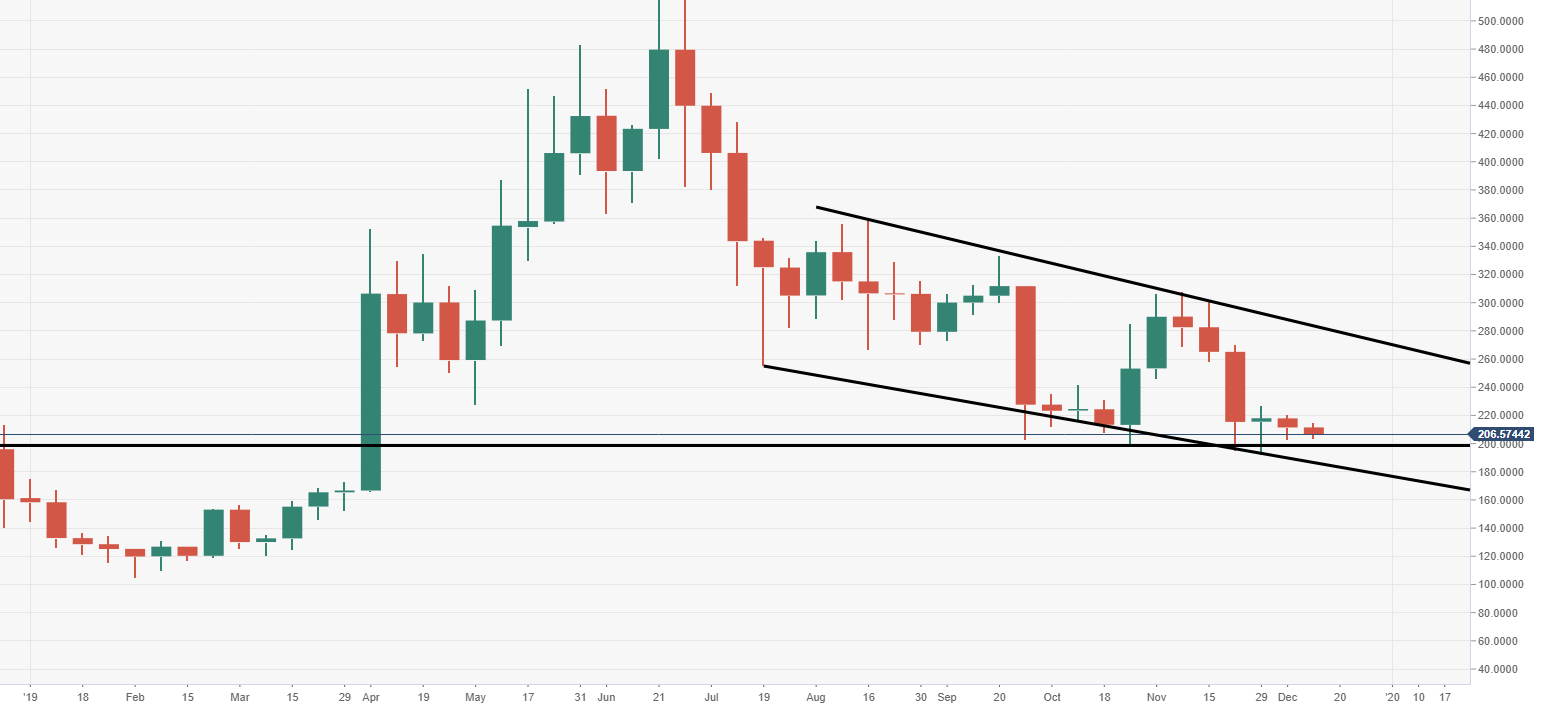
BCH/USD weekly chart
The current decline of BCH/USD via the weekly chart view, sees the price moving within a descending channel structure. It does technically make the Bitcoin Cash subject to breaking out higher.
BCH/USD daily chart
Price action via the daily chart view is still being contained by a bearish pennant structure.
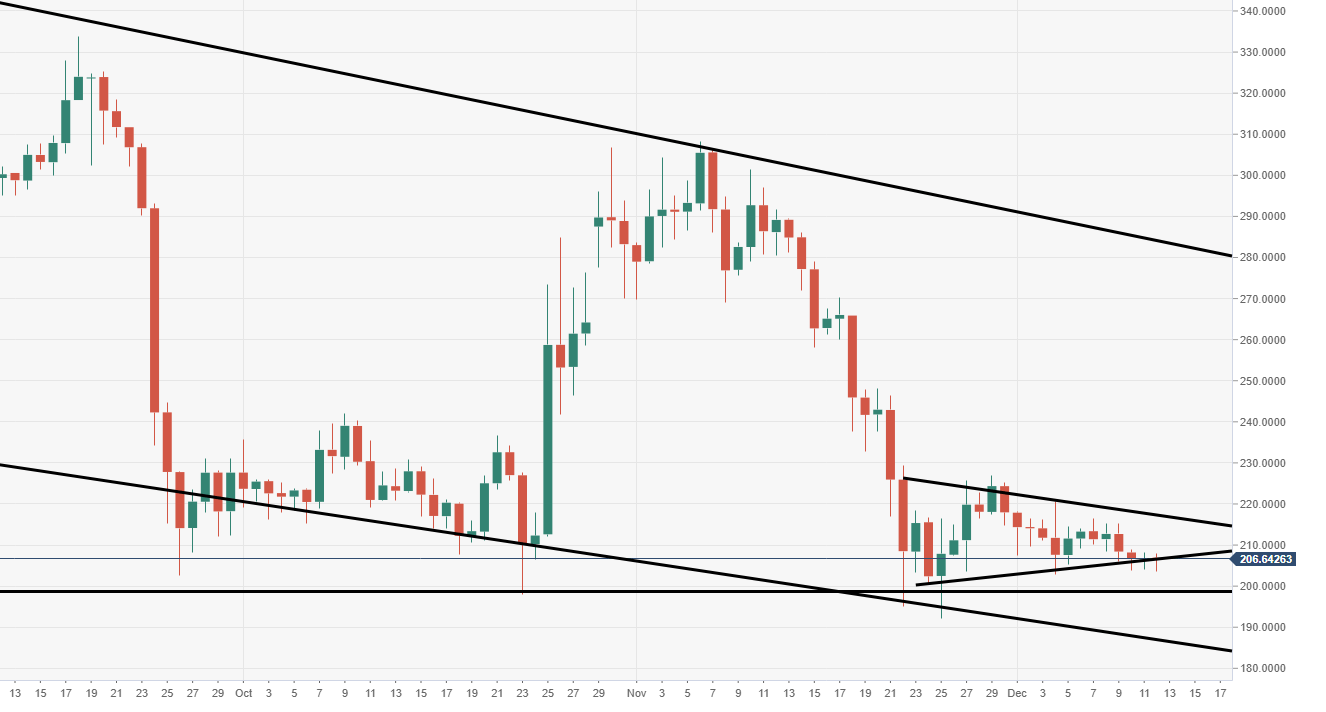
Spot rate: 206.50
Relative change: -0.10%
High: 207.84
Low: 203.53
Author

Ken Chigbo
Independent Analyst
Ken has over 8 years exposure to the financial markets. He started his career as an analyst, covering a variety of asset classes; forex, fixed income, commodities and equities.
More from Ken Chigbo


