Bitcoin Cash Price Forecast: Three signs that hint BCH could undo 210% gains
- Bitcoin Cash price more than tripled between June 19 and 30.
- A drop in Open Interest combined with a decline in aggregated futures CVD hints at a full-blown correction for BCH.
- The Wave Trend indicator is on the verge of producing a bearish crossover in the overbought region.
- Invalidation of the bearish thesis will occur if BCH flips $329 and produces a higher high.

Bitcoin Cash price experienced a massive surge in buying pressure in the third week of June, which caused BCH holders’ gains to triple in less than 11 days. However, this ascent risks a steep correction that could undo most of the gains.
Also read: Bitcoin Cash futures traders lose most in two-years as prices spike to $320
Bitcoin Cash price ready to reverse the uptrend
Bitcoin Cash price rose sharply between June 19 and 30, setting up a local top at $329 and currently trading at around $283. This upswing triggered $25 million worth of shorts to be liquidated. Shorts, or short positions, are bets made against an asset, meaning that investors believe the asset’s price will decrease. The last time daily liquidation hit such a level was on May 4 2021, more than two years ago.
High liquidation and a drop-off in Open Interest (OI) hints that a trend reversal could be near.
Furthermore, Bitcoin Cash’s rally appeared to be driven by futures positions. The aggregated futures Cumulative Volume Delta (CVD), represented in a white line in the chart below, shows an uptick during that period. However, CVD is also declining since the June 30 peak, in a sign that traders are closing their long positions.
Therefore, high liquidations, declining Open Interest and decreasing Cumulative Volume Delta are three key reasons explaining why a trend reversal could be around the corner for Bitcoin Cash price.
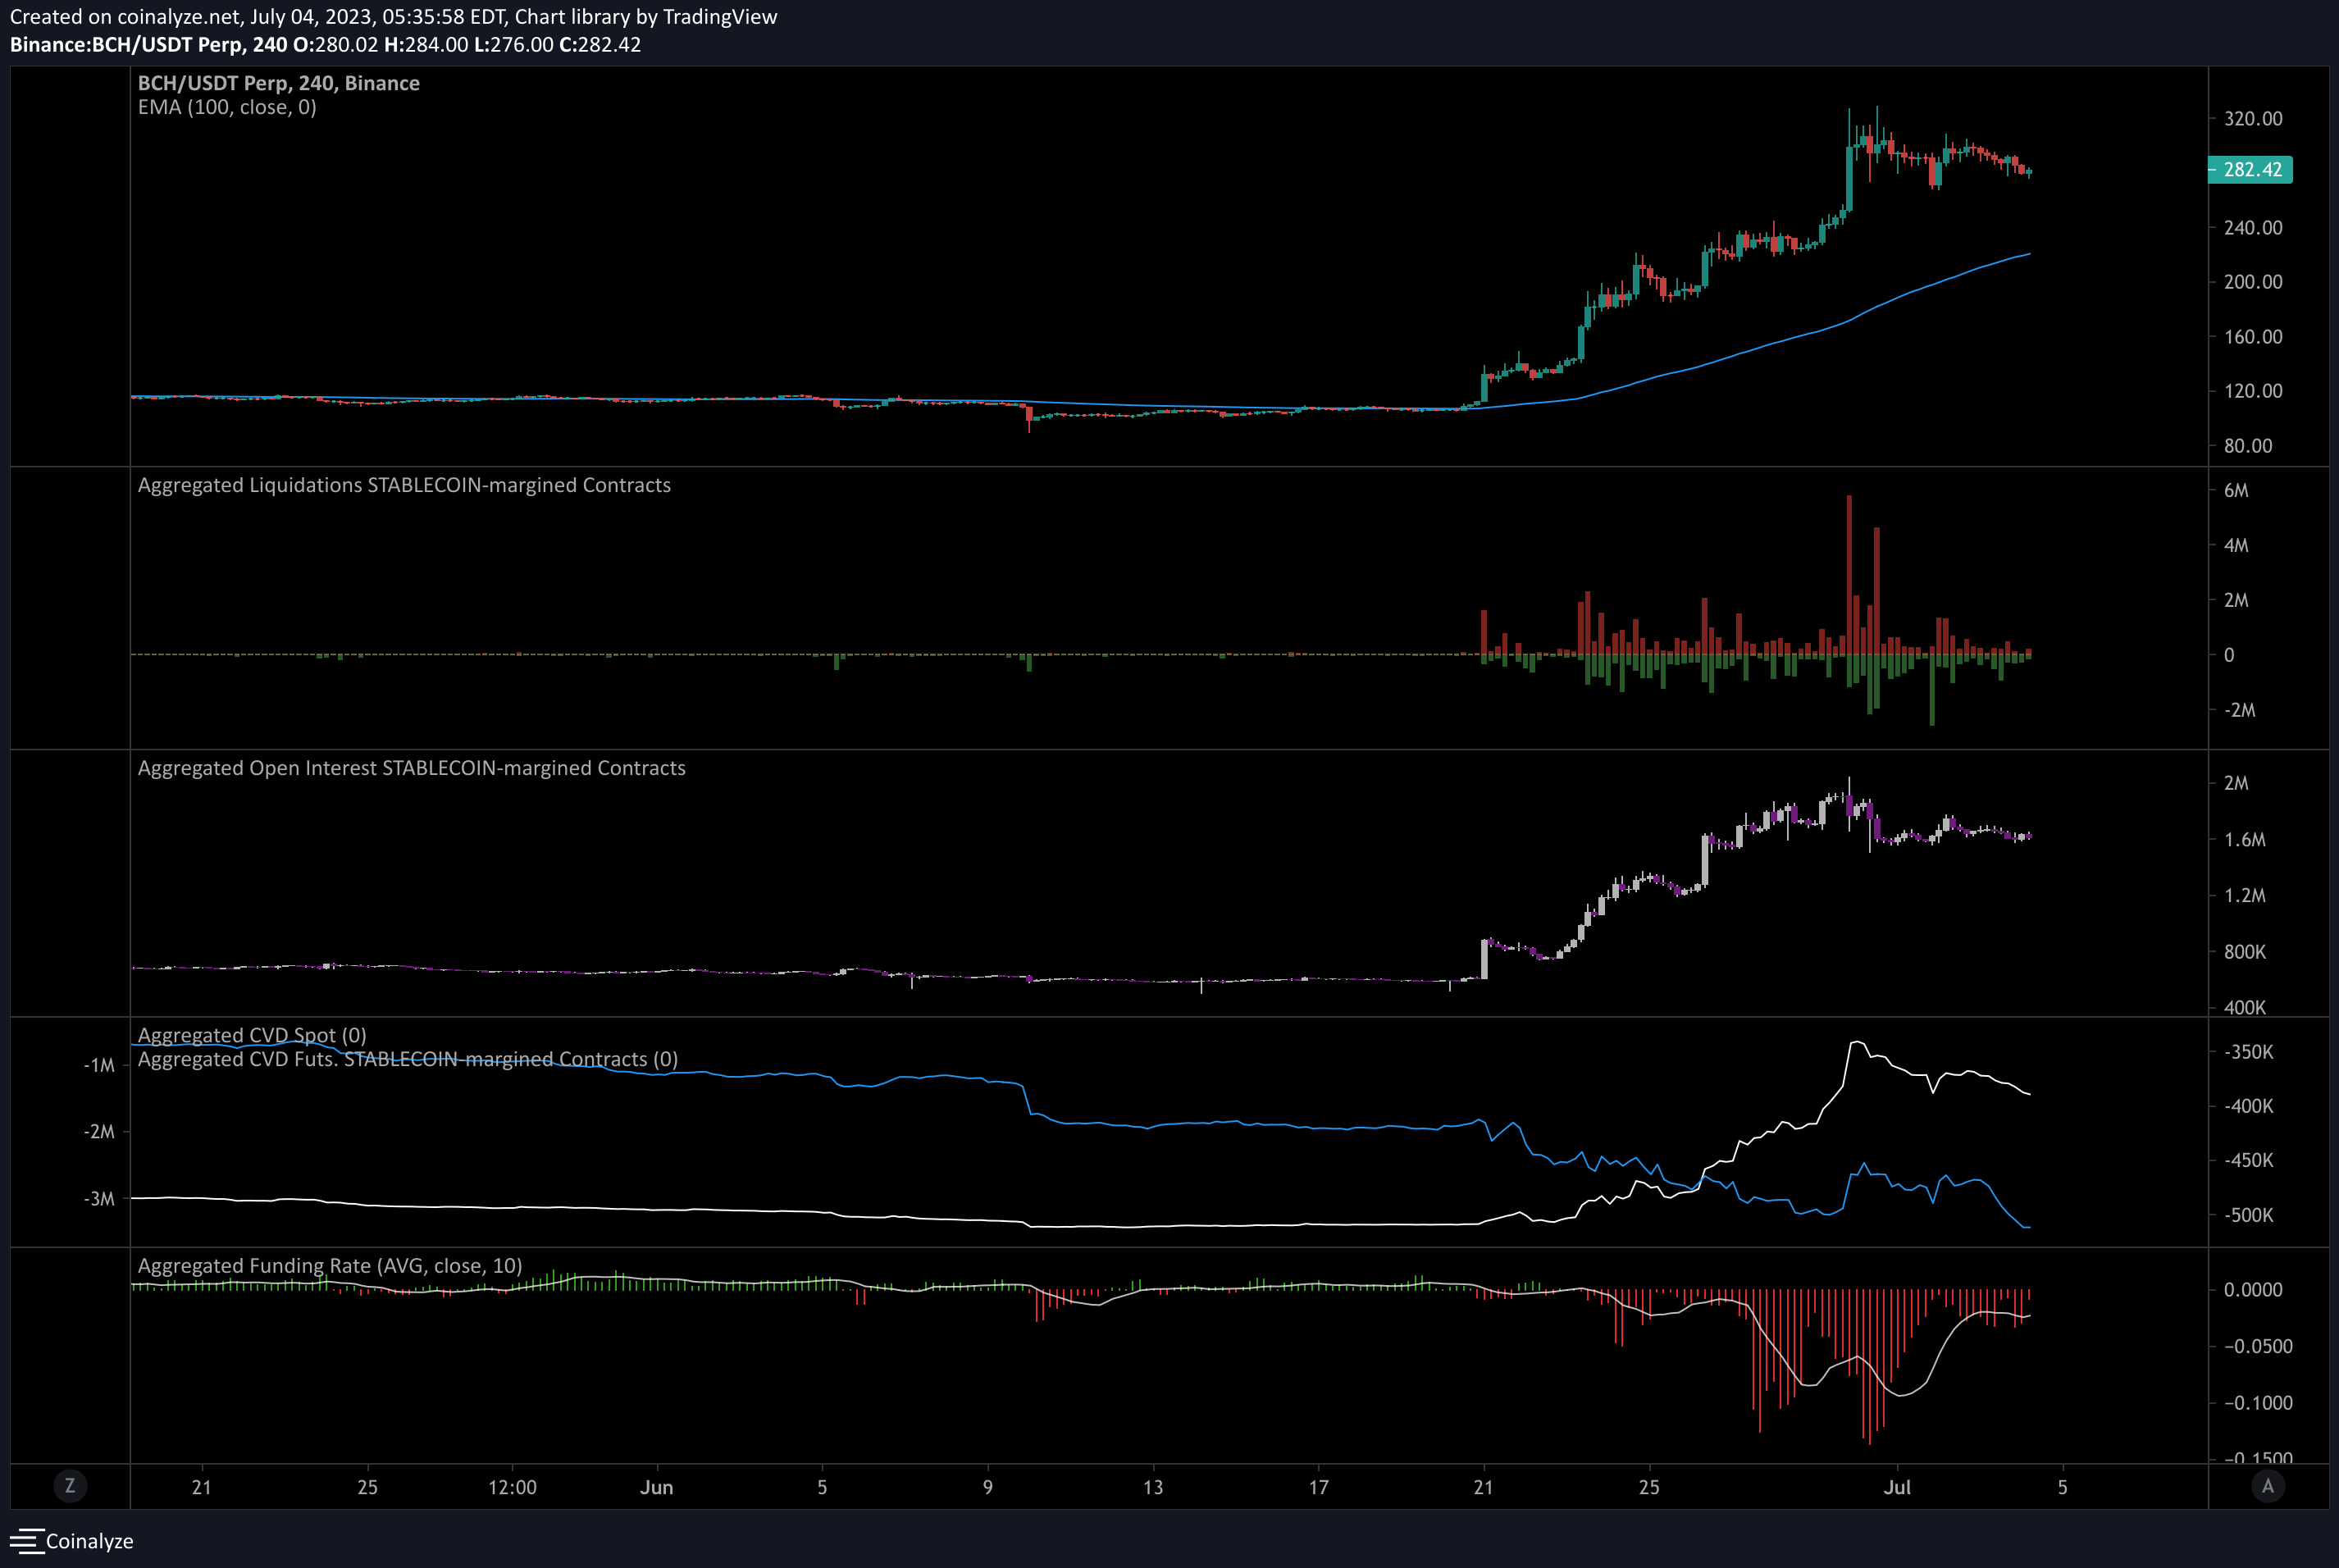
BCH/USDT 4-hour chart
Technicals also present a bearish case for Bitcoin Cash price
The daily chart for Bitcoin Cash price shows that the Wave Trend indicator is printing a potential bearish crossover in the overbought zone, a technical sign that adds to the bearish thesis.
The Relative Strength Index (RSI) has also produced a lower low at the same time as Bitcoin Cash price has produced a higher high. This contrast is termed bearish divergence and often leads to a decline in the asset’s price.
While these signals seem enough to push Bitcoin Cash price lower, investors can also observe the Awesome Oscillator (AO) indicator for secondary confirmation. A shift in AO’s histograms from green to red will signal that the bulls are losing control while bearish momentum is increasing. But a flip below the zero line on the daily chart will signal that the bears are in control of BCH.
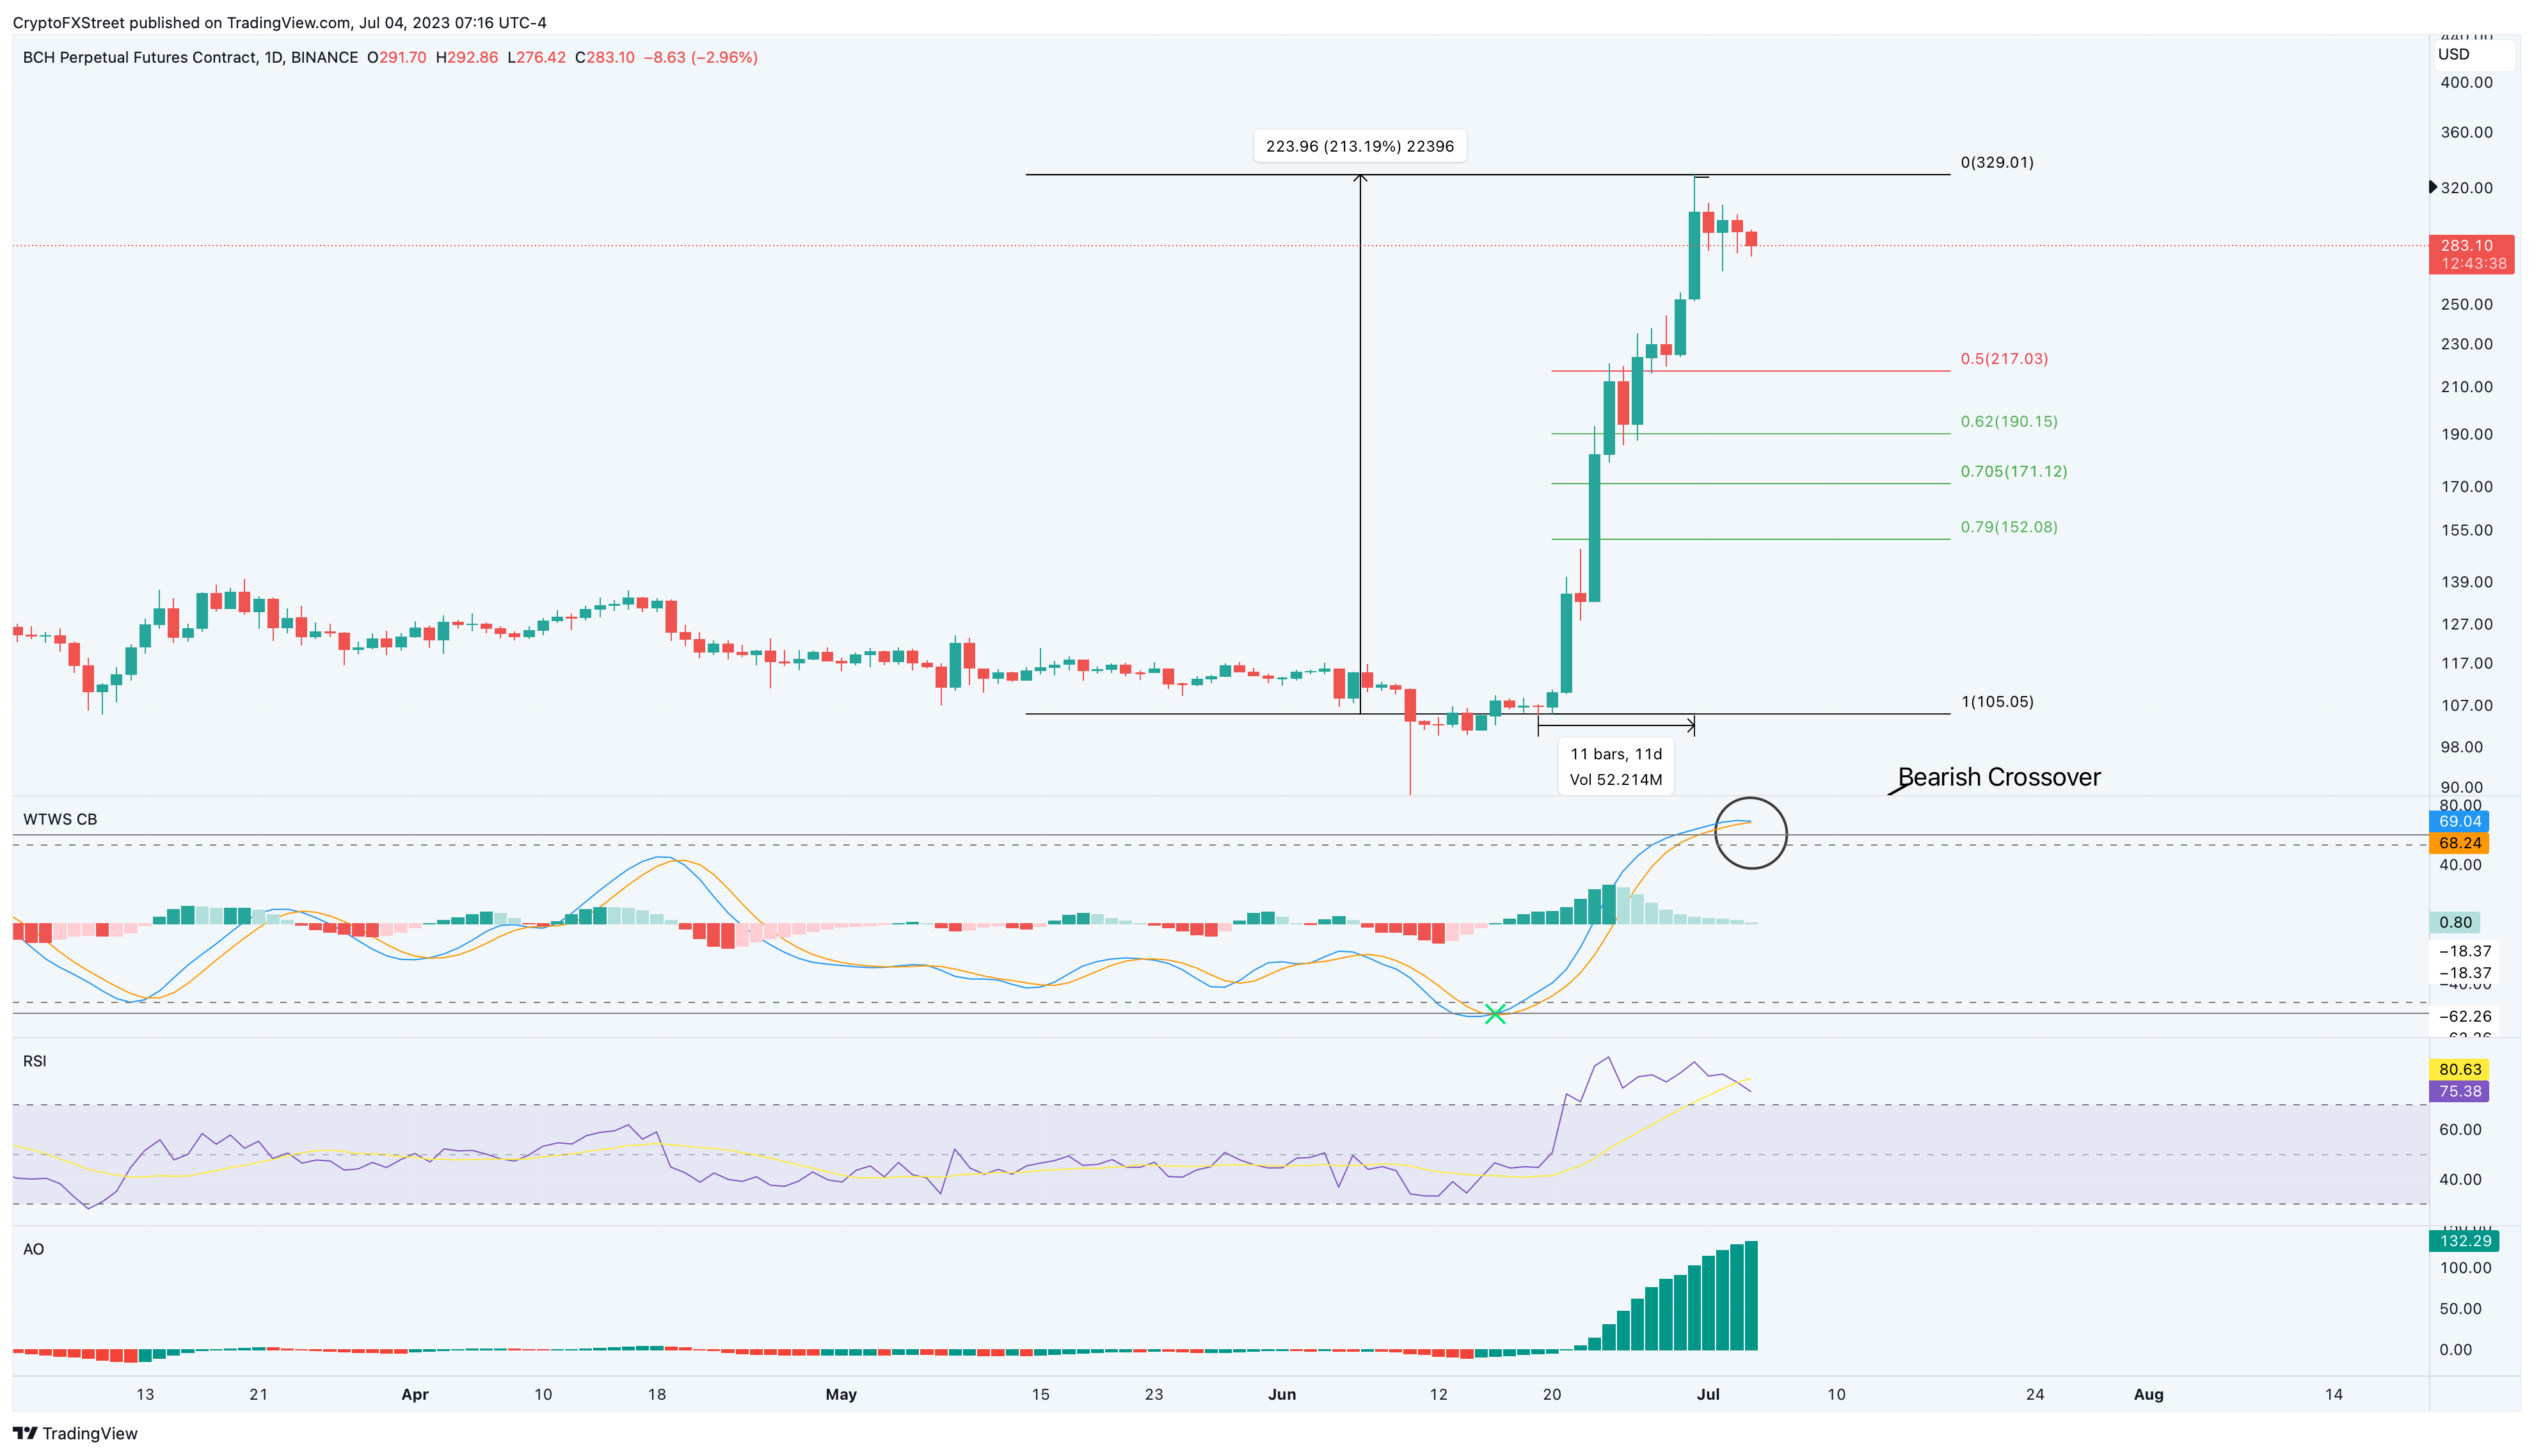
BCH/USDT 1-day chart
On the other hand, the bearish thesis will be invalidated if Bitcoin Cash price produces a higher high above $329 with the support of RSI and Wave Trend indicator.. In such a case, BCH bulls could signal that more gains are on the horizon and propel Bitcoin Cash price to tag the $350 hurdle.
Like this article? Help us with some feedback by answering this survey:
Author

Akash Girimath
FXStreet
Akash Girimath is a Mechanical Engineer interested in the chaos of the financial markets. Trying to make sense of this convoluted yet fascinating space, he switched his engineering job to become a crypto reporter and analyst.


