Bitcoin Cash Price Forecast: BCH rallies as transaction rate reaches a new all-time high
- Bitcoin Cash’s price rallies more than 7% on Wednesday after retesting its key support the previous day.
- On-chain metrics paint a bullish picture as BCH’s transaction rate reaches a new high, and open interest is also rising.
- The technical outlook suggests a rally ahead, targeting the $390.5 level.

Bitcoin Cash (BCH) price is rallying more than 7%, trading around $342 on Wednesday after retesting its key support level the previous day. On-chain metrics support the bullish outlook as BCH’s transaction rate reaches a new high, and open interest is also rising. Moreover, the technical outlook suggests a rally ahead, targeting the $390.5 level.
Bitcoin Cash transaction rate hits a new high
Data from Bitcoin Cash Explorer projects a bullish outlook for BCH. The data shows that the transaction rate reached a new all-time high of 3.6 on Wednesday, indicating a recent surge in traders’ interest and liquidity and signaling greater blockchain usage in the BCH chain.
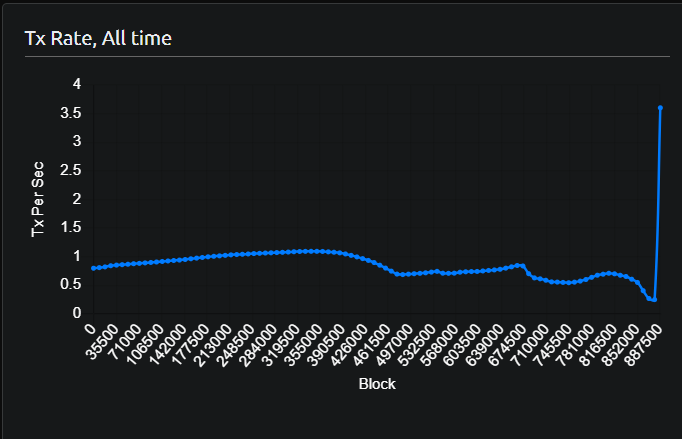
BCH Tx rate chart. Source: Bitcoin Cash Explorer
Bitcoin Cash’s Open Interest (OI) further supports the bullish outlook. Coinglass’s data shows that the futures’ OI in BCH at exchanges rose from $174.48 million on Sunday to $238.48 million on Wednesday, the highest level since early February. An increasing OI represents new or additional money entering the market and new buying, which suggests a rally ahead in the BCH price.
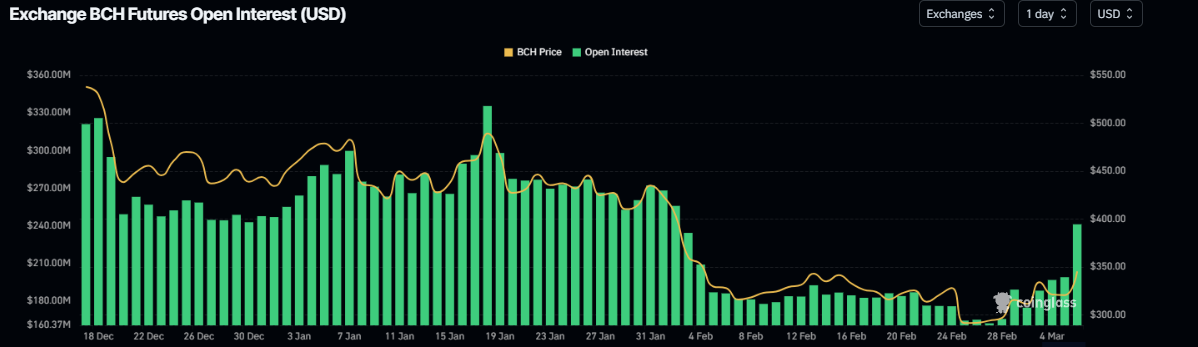
BCH open interest chart. Source: Coinglass
BCH bulls are aiming for the $390.5 mark
Bitcoin Cash price found support around its key range between $279.2 and $299.7 last week. Moreover, on Tuesday, it retested and bounced off from the support range and closed at $320.5. At the time of writing on Wednesday, it rallied by 7%, trading at around $342.4.
If the support range is maintained, BCH will extend the rally by nearly 13% from its current levels to retest its next resistance at $390.5.
The Relative Strength Index (RSI) on the daily chart reads 55, above its neutral level of 50 and points upwards, indicating bullish momentum. Moreover, the Moving Average Convergence Divergence (MACD) also showed a bulled crossover last week, suggesting an upward trend.
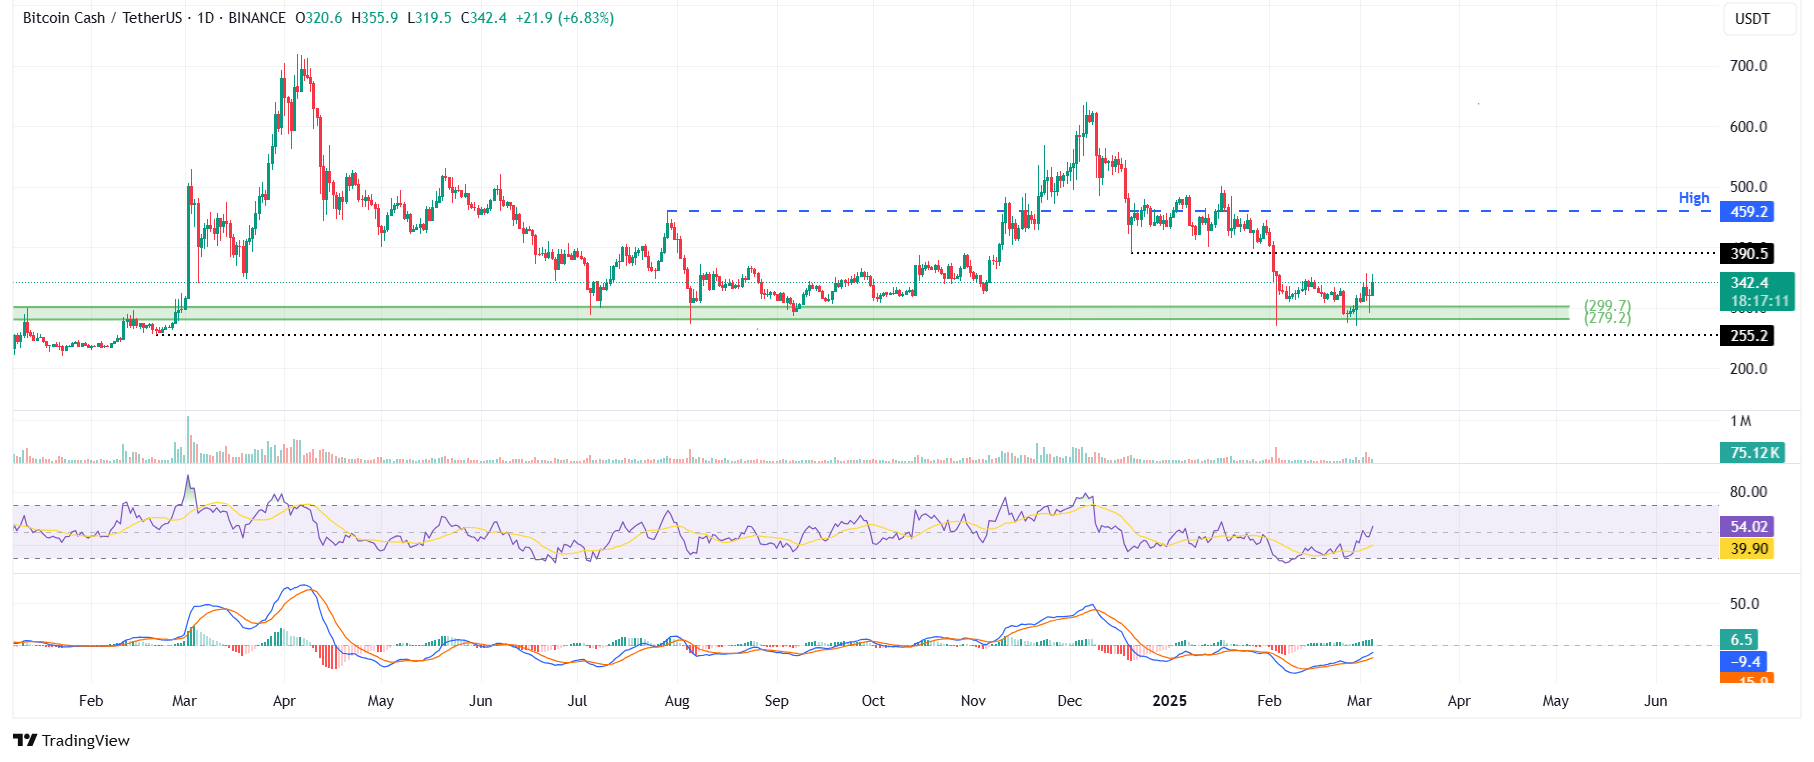
BCH/USDT daily chart
However, if BCH closes below the lower support range of $279.2, it could extend the decline February 21, 2024, low of $255.2.
Author

Manish Chhetri
FXStreet
Manish Chhetri is a crypto specialist with over four years of experience in the cryptocurrency industry.




