Bitcoin Cash Price Analysis: Next potential move for BCH/USD
- Bitcoin Cash price nursing some chunky losses of over 2.5% on Thursday, pressure seen across the market.
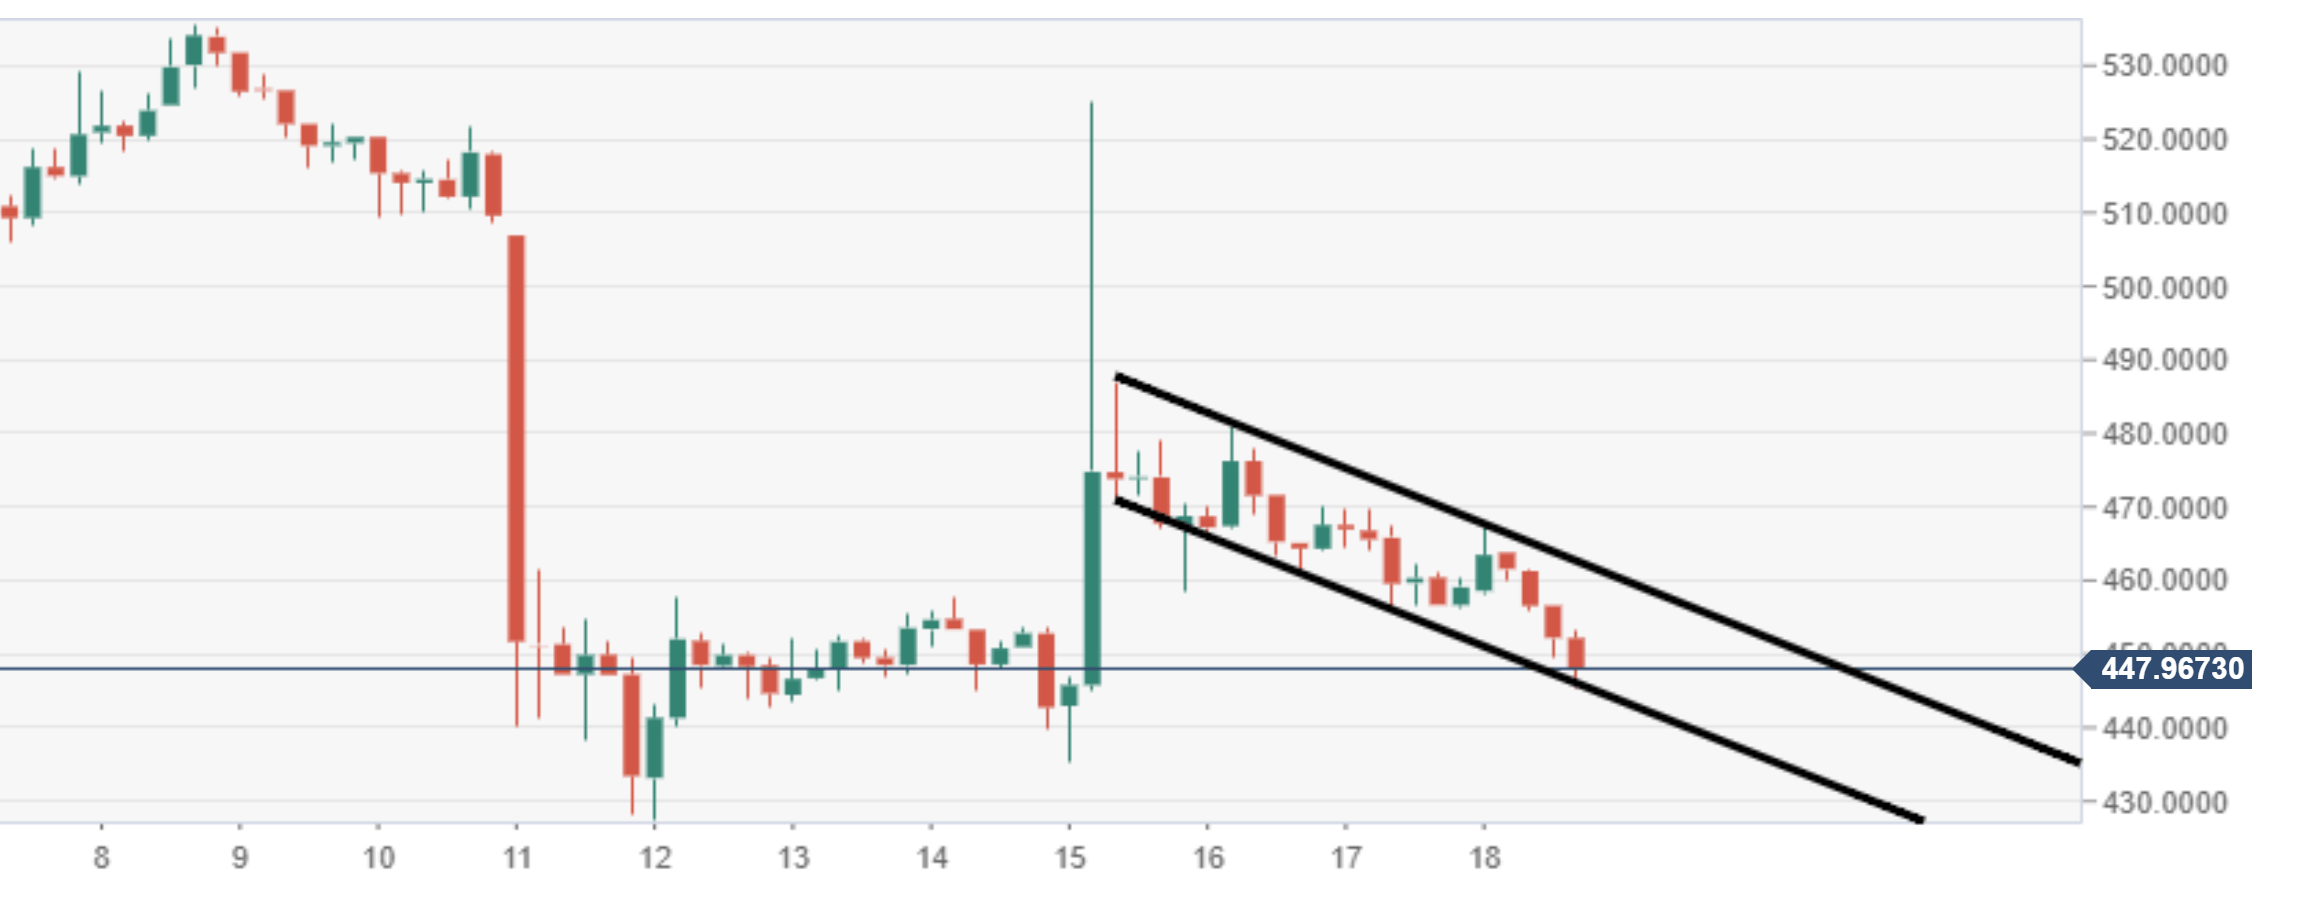
- Despite losses in the session, the price is still within this bullish flag pattern. However, bears are testing the lower support of this.

The Bitcoin Cash price was seen nursing losses just shy of 2.5% in the latter part of Thursday’s session. Prices across the crypto market remained somewhat depressed. Market participants continue to lack given commitment, after an extremely choppy past few weeks
BCH/USD price action as seen on the 60-minute chart view, is moving within a bullish flag pattern. Firmly within consolidation mode, post the aggressive spike higher on 15th October. Should the current formation play out to the textbook, expect an extended move to the upside.
Near-term support is eyed very close to current levels, $447. This is where the lower part of the bullish flag pattern is tracking. A breach will see $427 come into play for support, 12th October low and demand area. Resistance to the upside observed at $461, the upper tracking trend line of the flag.
BCH/USD 4-hour chart
Author

Ken Chigbo
Independent Analyst
Ken has over 8 years exposure to the financial markets. He started his career as an analyst, covering a variety of asset classes; forex, fixed income, commodities and equities.


