Bitcoin Cash Price Analysis: BCH sits on top of strong support barrier – Confluence Detector
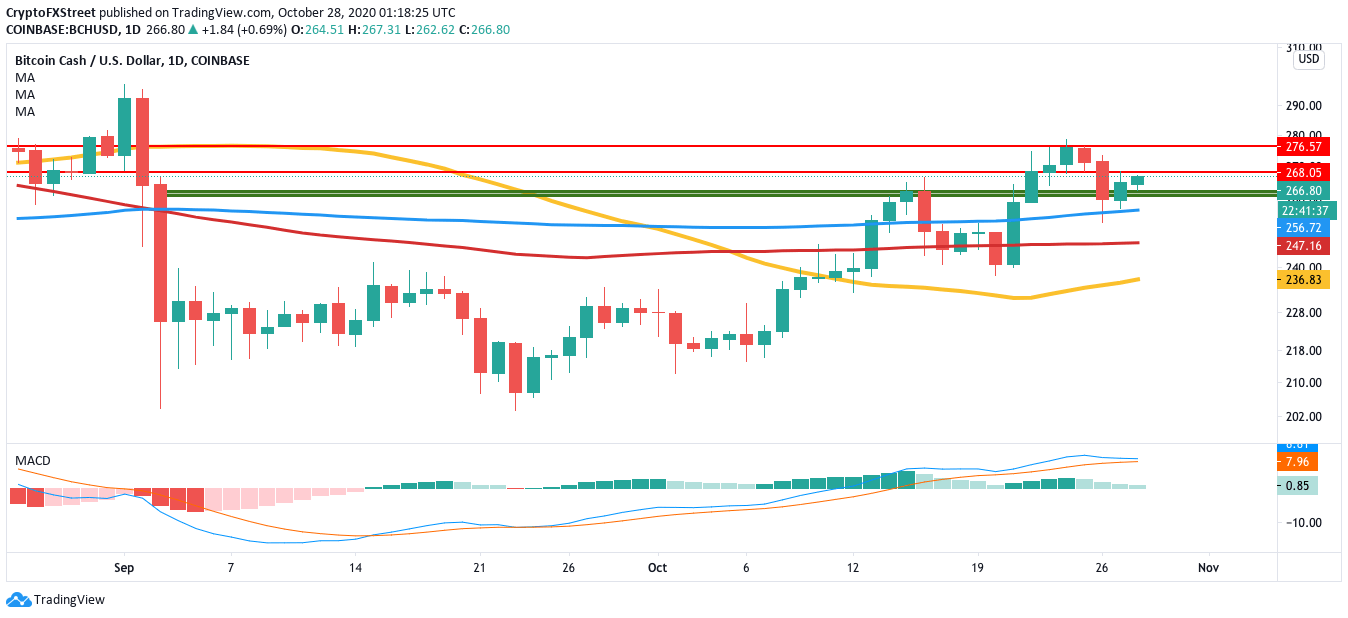
- The MACD in the daily chart for BCH shows sustained bullish momentum.
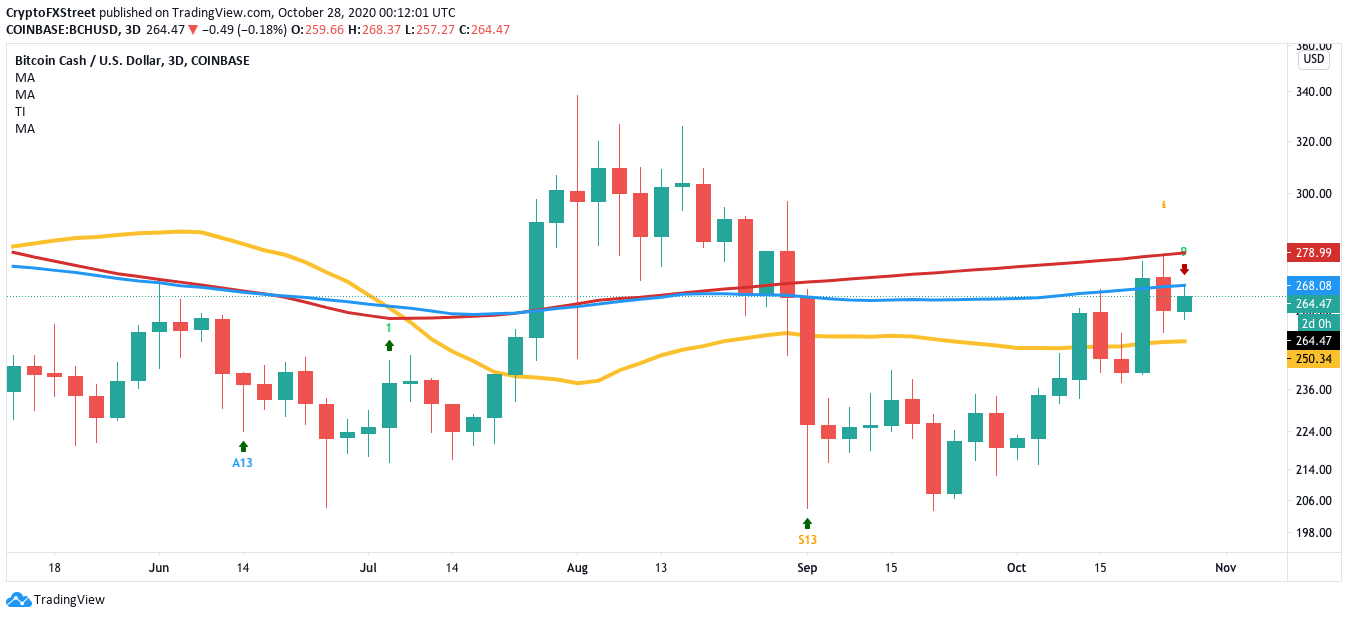
- The 3-day BCH chart has flashed a sell signal in the TD sequential with a green nine candlestick.

Bitcoin Cash rose from $240 and rose to $276 between October 21 and October 24. After that, the price dropped to ~$260, found support at the 100-day SMA and has gone up to $266.50, as of writing. Currently, BCH has two resistance walls upfront at $268 and $276. The MACD shows sustained bullish momentum.
BCH/USD daily chart
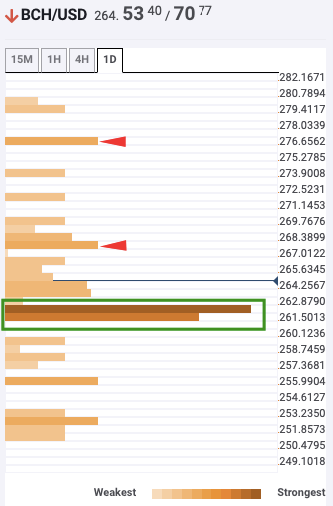
The daily confluence detector helps us visualize strong resistance and support levels. As per the tool, $268 and $276 has moderate resistance. If the buyers somehow manage to break past these barriers, they should reach $300.
BCH daily confluence detector
Another positive sign is the fact that the whales have been busy strengthening their positions. The number of addresses holding 10,000 - 100,000 tokens has gone up from 164 to 170 between October 25 and October 27. This is an extremely positive sign for the overall ecosystem.
BCH holders distribution
 [05.41.40, 28 Oct, 2020]-637394450730426605.png)
The Flipside: Can the bears take over?
While the overall outlook looks good for the bulls, there may be a short-term bearish correction around the corner. The 3-day chart for the Bitcoin fork has flashed the TD sequential indicator's sell signal via the green nine candlestick. This could see a price downturn to the 50-bar SMA ($250).
BCH/USD 3-day chart
Key price levels to watch
For the buyers, the $276 resistance line is crucial. Breaking past this level should give them a free path to $300.
The sellers will look to capitalize on the sell signal in the 3-day chart and drop the price to the 50-bar SMA ($250).
Author

Rajarshi Mitra
Independent Analyst
Rajarshi entered the blockchain space in 2016. He is a blockchain researcher who has worked for Blockgeeks and has done research work for several ICOs. He gets regularly invited to give talks on the blockchain technology and cryptocurrencies.



