Bitcoin Cash Market Overview: BCH/USD getting ready for a breakout?
- BCH/USD went down from $390.50 to $384 this Wednesday.
- Price may be consolidating before bulls test $400 level.

BCH/USD went down from $390.50 to $384 in the early hours of Wednesday. Bitcoin Cash looks like it is in a consolidation phase. If the bulls can gain enough momentum following the consolidation, the price will surpass $400. If that does happen, then it will be the first time since November 2018 when BCH/USD was able to do so.
BCH/USD Daily Chart
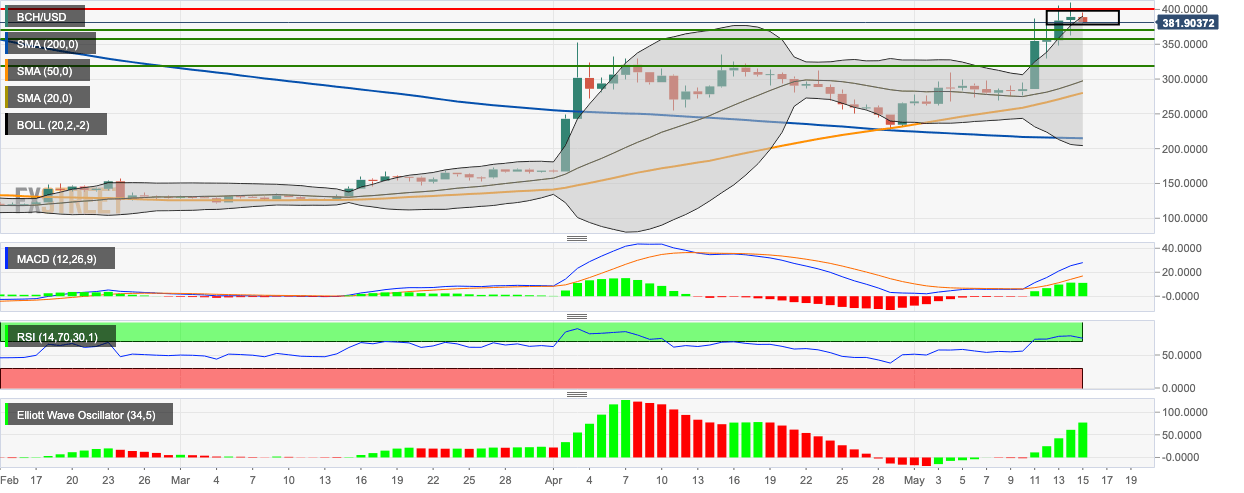
- BCH/USD is consolidating in a flag formation.
- The 20-day Bollinger band’s widening jaw shows increasing market volatility.
- The latest bearish session brought the price back inside the Bollinger band.
- The price is trending above the SMA 200, SMA 50, and SMA 20 curves.
- The signal line has diverged away from the MACD line showing bullish momentum.
- The Elliot Wave Oscillator shows five consecutive bullish sessions.
- The relative strength index (RSI) indicator is still lurking inside the overbought zone though it looks like it will be creeping out soon.
Author

Rajarshi Mitra
Independent Analyst
Rajarshi entered the blockchain space in 2016. He is a blockchain researcher who has worked for Blockgeeks and has done research work for several ICOs. He gets regularly invited to give talks on the blockchain technology and cryptocurrencies.
More from Rajarshi Mitra


