|

Bitcoin Cash Chart Analysis: Symmetrical triangle breakout on 1H, more gains likely?

  • BCH/USD off the highs, but bullish bias intact.
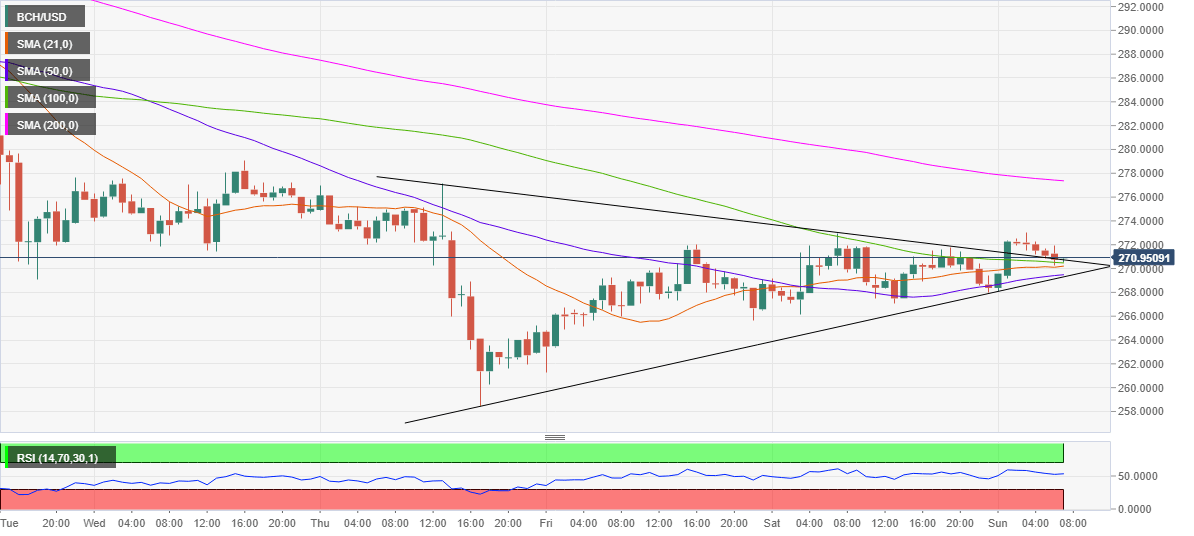
  • No. 6 coin sees a symmetrical triangle breakout on hourly chart.
  • 200-HMA is likely to be tested in the near-term.

Bitcoin Cash (BCH/USD) caught a fresh bid-wave in early trades this Sunday and rose as high as $273.02 before reversing towards $270 levels, where it now wavers.

Despite the minor pullback from daily highs, the spot trades nearly 1% higher on a daily basis, enjoying a market capitalization of $5.08 billion.

The bulls are gathering pace for the next push higher, especially in the wake of a symmetrical triangle breakout confirmed on the hourly chart after the coin closed the hour above falling trendline (pattern) resistance, then located at $271.30.

The buyers now aim for the pattern target at $290. Ahead of that level, the 200-hourly Simple Moving Average (HMA) at $277 will be the level to beat for the BCH bulls.

Alternatively, a cluster of critical support at $270 should cushion the downside. That level is the confluence of the pattern resistance now turned support, 21 and 100-HMAs.  

A break below which the next support at $269 will be put to test. Friday’s low of $266.10 will be next on the sellers’ radar.

BCH/USD: Hourly chart

fxsoriginal

BCH/USD: Additional levels to consider

BCH/USD

Overview
Today last price270.7571
Today Daily Change2.3722
Today Daily Change %0.88
Today daily open268.3765
 
Trends
Daily SMA20288.8715
Daily SMA50272.9266
Daily SMA100255.1544
Daily SMA200262.4887
 
Levels
Previous Daily High272.9035
Previous Daily Low266.1049
Previous Weekly High294.8808
Previous Weekly Low258.4607
Previous Monthly High306.6192
Previous Monthly Low215.8202
Daily Fibonacci 38.2%268.702
Daily Fibonacci 61.8%270.3064
Daily Pivot Point S1265.3531
Daily Pivot Point S2262.3297
Daily Pivot Point S3258.5546
Daily Pivot Point R1272.1517
Daily Pivot Point R2275.9268
Daily Pivot Point R3278.9502

Author

Dhwani Mehta

Dhwani Mehta

FXStreet

Residing in Mumbai (India), Dhwani is a Senior Analyst and Manager of the Asian session at FXStreet. She has over 10 years of experience in analyzing and covering the global financial markets, with specialization in Forex and commodities markets.

More from Dhwani Mehta
Share:

Editor's Picks

Crypto Overview: Bitcoin stabilizes above $65,000, as Zcash and Worldcoin lead broader recovery

Bitcoin shows signs of recovery, trading above $65,000 on Monday, as the broader crypto market rebounds, fueled by improving sentiment following the United States (US) and Iran's confirmation of a preliminary peace agreement.

Crypto Today: Bitcoin, Ethereum, XRP recovery gathers strength as US-Iran reach peace agreement

Cryptocurrency prices remain broadly elevated on Monday, led by Bitcoin’s upswing toward $66,000. Altcoins, including Ethereum and Ripple, mirror Bitcoin’s momentum, trading above $1,700 and $1.18.

Bitcoin extends rebound as US and Iran reach framework deal to end the war

Bitcoin steadies above $65,700 at the time of writing on Monday, after recovering nearly 4% in the previous week. BTC recovery was boosted following Sunday’s news that the US and Iran have reached a preliminary peace deal, lifting the risk appetite.

Pi Network Price Forecast: Launchpad upgrades, fading bearish pressure lift recovery prospects

Pi Network (PI) began the week on a positive note, trading above $0.1340 on Monday after posting a mild recovery and closing above a key resistance in the previous week.

Experts agree: Bitcoin nears bottom, but weak demand raises doubts
Bitcoin (BTC) is trading above $63,000 at the time of writing on Friday after rebounding from the key 200-week Simple Moving Average (SMA) near $62,000, a level widely viewed as key long-term support. The recovery may suggest that Bitcoin has found a floor after a sharp correction that spanned more than a month, but some warning signs persist.