|

Bitcoin Cash Chart Analysis: Downside appears compelling amid bearish technical set up

  • BCH/USD is back to the red zone, in a familiar range on Sunday.
  • No. 5 coin looks vulnerable amid bearish technical setup.  
  • Hourly RSI pierced 50.00 from above, more losses likely?

Bitcoin Cash (BCH/USD) is seeing aggressive selling over the last hour, after having witnessed a volatile session late Saturday. Holiday-thinned trading conditions across the crypto board triggered a $7 rally in the coin in a matter of 15 minutes. The price hit fresh weekly highs at $229.31, in an unusual spike.  Saturday. The bulls failed to sustain at higher levels, as the bears appear to fight back control in Sunday’s trading so far. The digital asset has returned to the familiar range around $222, down over 1.30% on a daily basis while on track to book 2.20% weekly gain. The market capitalization for BCH/USD stands at $4.12 billion.

BCH/USD: Hourly chart

fxsoriginal

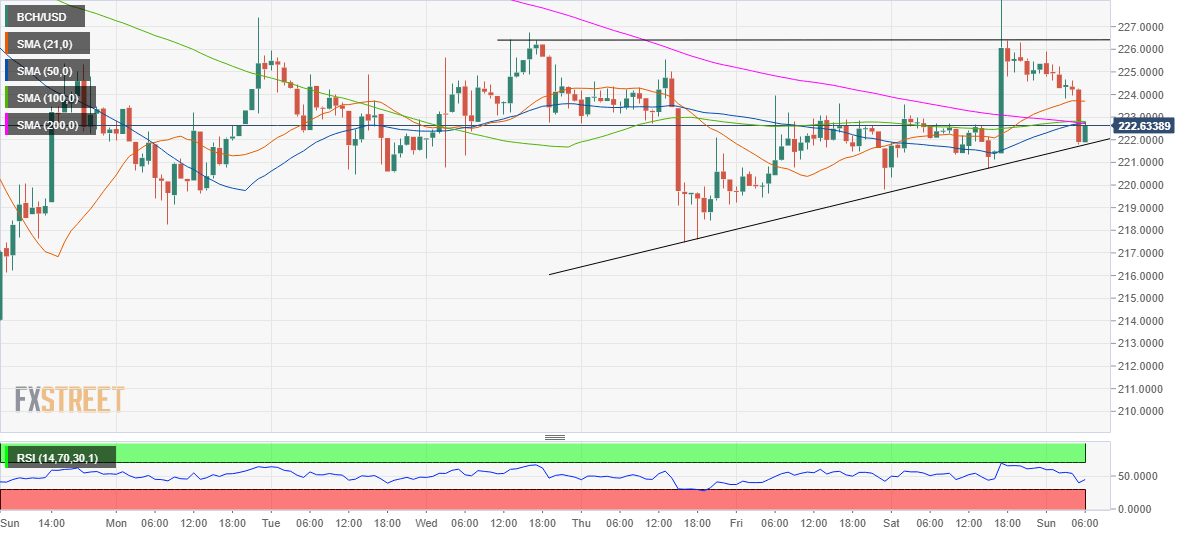
The coin is teasing an ascending triangle on the hourly chart this Sunday, with the pattern target of $213 in sight should the price close the hour below rising trendline support of $221.78.

On its way to the said target, BCH/USD bulls could find support near Thursday low of $217.46. The pair remains vulnerable as the hourly Relative Strength Index (RSI) has pierced the 50 midline from above to now trade in the bearish territory at 42.40.

Also, the fifth most favorite coin has slipped below all the major hourly Simple Moving Averages (HMA).

The minor recoveries should meet fresh supply at $222.80, where a cluster of support-turned-resistance of the 200, 100 and 50-HMAs are stacked up. A breakthrough the latter, the price could confront the 21-HMA barrier at $223.70 on its way to retest the 227 level.  

BCH/USD: Additional levels to consider

BCH/USD

Overview
Today last price221.9090
Today Daily Change-3.4581
Today Daily Change %-1.53
Today daily open225.3579
 
Trends
Daily SMA20229.9215
Daily SMA50237.7349
Daily SMA100237.8158
Daily SMA200269.5838
 
Levels
Previous Daily High229.3149
Previous Daily Low220.3154
Previous Weekly High227.3836
Previous Weekly Low213.3598
Previous Monthly High269.2895
Previous Monthly Low204.6275
Daily Fibonacci 38.2%225.8771
Daily Fibonacci 61.8%223.7532
Daily Pivot Point S1220.6772
Daily Pivot Point S2215.9966
Daily Pivot Point S3211.6777
Daily Pivot Point R1229.6767
Daily Pivot Point R2233.9956
Daily Pivot Point R3238.6763

Author

Dhwani Mehta

Dhwani Mehta

FXStreet

Residing in Mumbai (India), Dhwani is a Senior Analyst and Manager of the Asian session at FXStreet. She has over 10 years of experience in analyzing and covering the global financial markets, with specialization in Forex and commodities markets.

More from Dhwani Mehta
Share:

Editor's Picks

Ripple Price Forecast: XRP potential bottom could be in sight

Ripple edges up above the intraday low of $1.35 at the time of writing on Friday amid mixed price actions across the crypto market. The remittance token failed to hold support at $1.40 the previous day, reflecting risk-off sentiment amid a decline in retail and institutional sentiment. 

Crypto Today: Bitcoin, Ethereum, XRP in choppy price action, weighed down by falling institutional interest 

Bitcoin holds above support at $65,118 at the time of writing on Friday. Ethereum remains choppy in a narrow range between support at $1,900 and resistance at $2,000, while Ripple attempts another upward move toward the pivotal $1.40 level.

PancakeSwap Price Analysis: Bearish momentum suggests further downside

PancakeSwap (CAKE) is trading below $1.26 at the time of writing on Friday, extending the losses by over 8% so far this week. The weakening derivatives market further supports the bearish outlook, with bears aiming for levels below $1.18.

Decred Price Forecast: DCR rebounds toward key resistance zone on volume spike

Decred (DCR) rebounds over 7% at press time on Friday after a three-day decline of almost 14%. Roughly 60% increase in trading volume over the last 24 hours supports the recovery, suggesting heightened spot-market demand. 

Bitcoin Price Annual Forecast: BTC holds long-term bullish structure heading into 2026

Bitcoin (BTC) is wrapping up 2025 as one of its most eventful years, defined by unprecedented institutional participation, major regulatory developments, and extreme price volatility.

Bitcoin: BTC bears aren’t done yet

Bitcoin (BTC) price slips below $67,000 at the time of writing on Friday, remaining under pressure and extending losses of nearly 5% so far this week.