Bitcoin bullish outlook intact on touching $40,000 again, but Glassnode’s SOPR hints at healthy correction
- Bitcoin SOPR is at extreme overbought conditions suggesting that the bull-run still is intact.
- Short-term Bitcoin holders (traders) are helping to push Bitcoin in profit.
- The Entity-Adjusted SOPR points to a possible pullback after overshadowing the 2017 top.

Bitcoin boasts of a nearly 30% rebound after touching the major support at $30,000 early this week. Despite the massive liquidations in the futures market, which saw over $1.5 billion wiped off, BTC presented a strong bullish front, bringing down the seller congestion at $36,000 and $38,000.
At the time of writing, the bellwether cryptocurrency is trading marginally above $39,000 after touching $40,000 on Friday during the Asian session. The Spent Output Profit Ration (SOPR), an on-chain metric by Glassnode, is exceptionally overbought, as Rafael Schultze-Kraft discussed, a renowned on-chain analyst. This situation calls for a couple of events; Bitcoin may settle for consolidation or embrace some mid-term but healthy pullbacks.
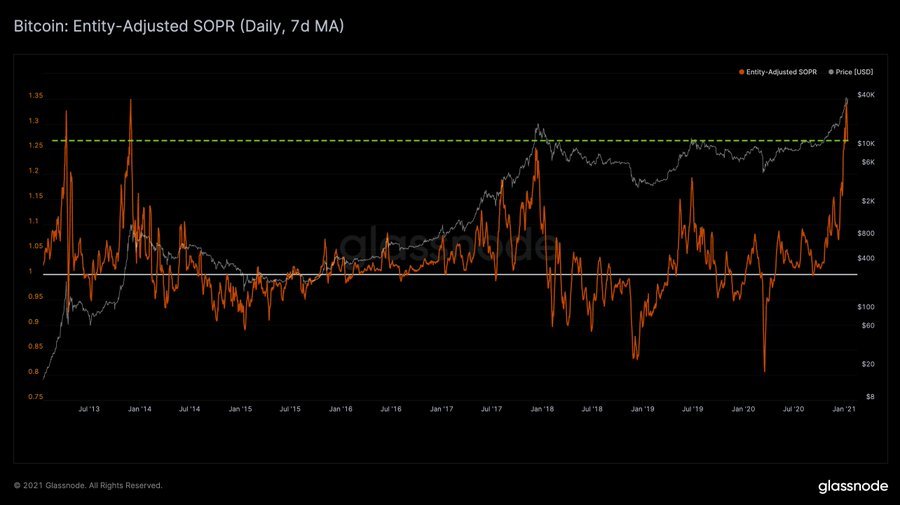
Bitcoin SOPR chart by Glassnode
Bitcoin’s 2020/2021 bull run differs from the retail-driven 2017 bull cycle
The adjusted SOPR significantly pulled back recently but held firmly at 1.13. Despite the correction, it remains well above average. Besides, it does not seem poised for a further retreat under the 1-line in the near-term. Nonetheless, a reset is not always mandatory because, in 2017, the aSOPR went for months without it.
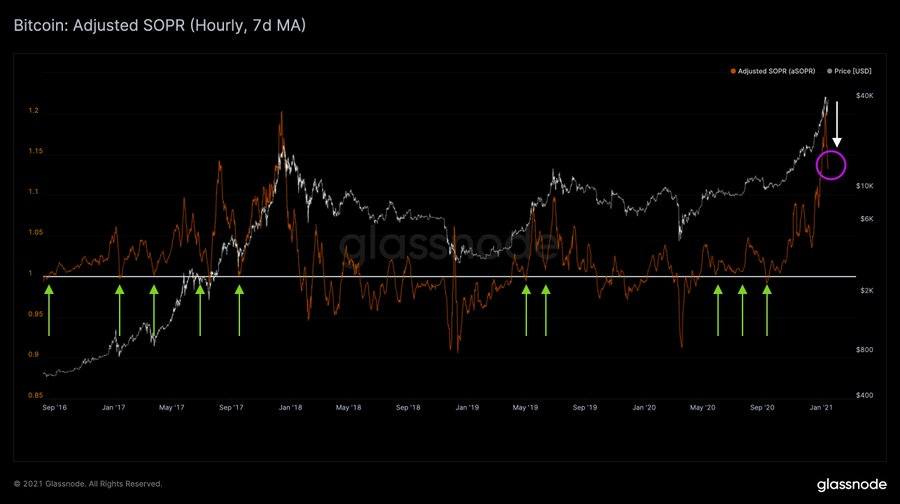
Bitcoin’s aSOPR chart by Glassnode
Understanding the SOPR
The SOPR is an on-chain metric developed by Renato Shirakashi. It is arrived at by dividing the realized value (in USD) by its value at creation (USD) of a spent output. In other words, price sold/price paid.
Notably, a SOPR value beyond one suggests that investors of spent outputs realize profits at the transaction time; any other value below one means that they are at a loss. A graph like the one above is produced by plotting the SOPR of the spent outputs altogether and aggregated by the particular day they were spent.
Who is behind Bitcoin SOPR high levels?
The Bitcoin market has been known to have been dominated by a handful of large volume long-term holders. Although these long-term BTC holders are highly profitable, the Short-Term Holder SOPR suggests that traders are helping to move the largest cryptocurrency at a profit. It is worth keeping in mind that the Short-Term Holder SOPR only accounts for outputs younger than 155 days.
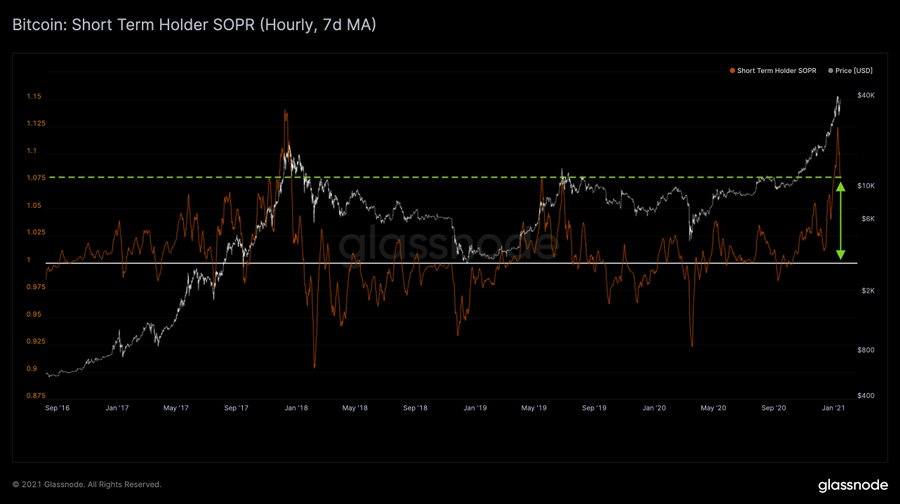
Bitcoin Short-Term Holder SOPR
Similarly, the Long-Term Holder SOPR is impressively on an upward path. However, it is a long way to 20, a value used to identify global tops in the past. The chart also shows a decent recent surge, almost in a perfectly straight line, showing little or zero volatility. This metric only puts into consideration outputs that are at least 155 days. It is used to study the behavior of long-term BTC investors.
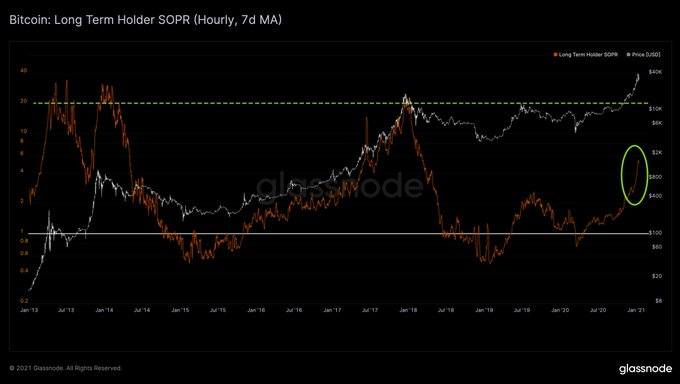
Bitcoin Long-Term Holder SOPR
Another variant of the SOPR is the Entity-adjusted SOPR. It is applied to cancel the noise and does this by accounting for only the BTC that actually moved or exchanged hands. In simpler terms, the metric ignores the transaction taking place between addresses of the same entity. Therefore, it focuses on real economic activity.
The Entity-Adjusted SOPR has maintained extremely high levels over the last 30 days. A correction from its recent high still sits at the top in 2017, suggesting that Bitcoin is poised for a pullback.
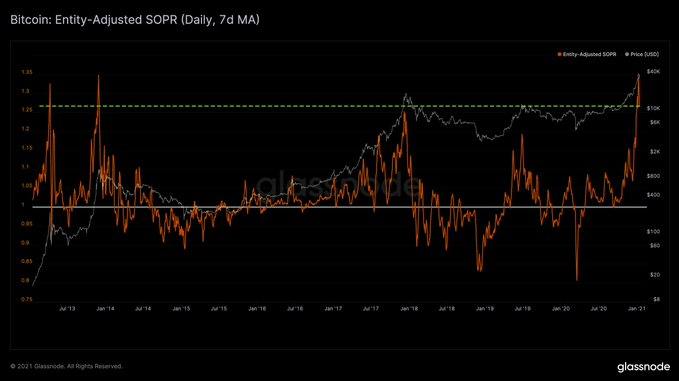
Bitcoin Entity-Adjusted SOPR
Bitcoin’s ongoing bull run has proved to be different from the retail-driven run seen in 2017. Thus, technical levels and indicators are behaving differently. It also calls for caution among investors for proper risk management.
Meanwhile, the trend is still bullish, but it is essential to keep in mind the potential consolidation and pullbacks (healthy), mostly if we don’t crack $40,000.
%20-%202021-01-15T061636.383-637462787111297817.png)
BTC/USD 4-hour chart
At the time of writing, Bitcoin is doddering at $38,900 following a rejection at $40,000. Short-term support is expected at $38,000, which might give way for a period of consolidation. However, more declines will come into the picture if Bitcoin slides under the 50 Simple Moving Average.
Author

John Isige
FXStreet
John Isige is a seasoned cryptocurrency journalist and markets analyst committed to delivering high-quality, actionable insights tailored to traders, investors, and crypto enthusiasts. He enjoys deep dives into emerging Web3 tren