- Bitcoin has settled above $10,000 but the further upside looks limited.
- A critical resistance of $11,000 is still out of reach.
- TD Ameritrade's CEO notices a growing interest in digital assets.
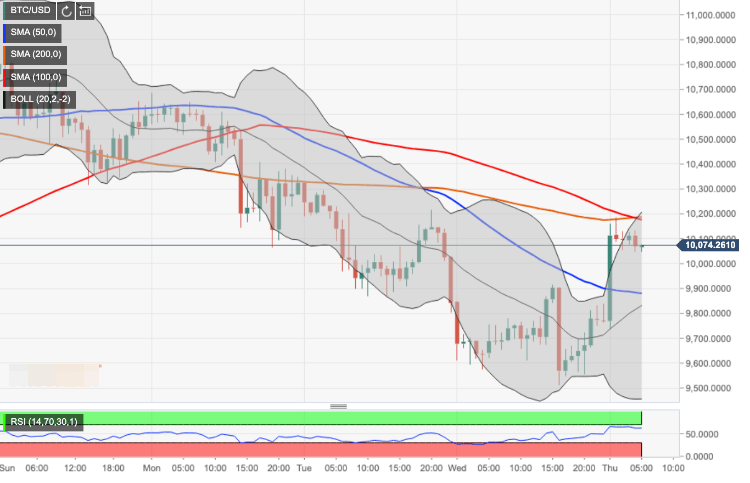
Bitcoin (BTC) managed to recover above $10,000 handle, but the upside momentum seems to be fading away. The first digital coin touched an intraday high at $10,185 and retreated towards $10.050 by the time of writing. BTC/USD has gained about 4.5% on a day-on-day basis and 3% since the beginning of Thursday.
Meanwhile, according to the head of US-based broker TD Ameritrade, Tim Hockey, the interest towards digital assets is on the rise again. He mentioned that the customers of the company were asking about Bitcoin and other digital assets more often. Moreover, scrutiny from the regulators and policymakers towards Facebook's Libra is one of the catalysts of growing interest, according to Hockey.
"There is a lot of regulatory scrutiny, whether it be for Libra or crypto generally. We would like to be able to participate, but we want to be comfortable with the risk to our clients and ourselves in a world where crypto has still got lots of debate about a number of items that we're all hearing about," he said in the interview with The Street.
Bitcoin's technical picture
Meanwhile, BTC/USD recovery is capped by $10,200. This barrier is strengthened by a confluence of technical indicators: the intraday high of $10,185, SMA50 (Simple Moving Average) 4-hour, SMA100 and SMA200 1-hour and the upper line of 1-hour Bollinger Band.
Once it is out of the way, the upside is likely to gain traction with the next focus on $10,450 and $10,650 (the upper line of 4-hour Bollinger Band). That's where new sellers may pop in and stop the recovery. However, a sustainable move above this handle may unleash bullish potential and push the price towards a critical $11,000.
On the downside, a sustainable move below $10,000 will push the price towards the initial support of $9,800 (SMA50 1-hour and the middle line of 1-hour Bollinger Band) This support is followed by $9,450 (the lower line of 1-hour Bollinger Band).
BTC/USD, 1-hour chart
Note: All information on this page is subject to change. The use of this website constitutes acceptance of our user agreement. Please read our privacy policy and legal disclaimer. Opinions expressed at FXstreet.com are those of the individual authors and do not necessarily represent the opinion of FXstreet.com or its management. Risk Disclosure: Trading foreign exchange on margin carries a high level of risk, and may not be suitable for all investors. The high degree of leverage can work against you as well as for you. Before deciding to invest in foreign exchange you should carefully consider your investment objectives, level of experience, and risk appetite. The possibility exists that you could sustain a loss of some or all of your initial investment and therefore you should not invest money that you cannot afford to lose. You should be aware of all the risks associated with foreign exchange trading, and seek advice from an independent financial advisor if you have any doubts.
Recommended Content
Editors’ Picks
Ripple's move above this key level could trigger nearly 50% rally for XRP
Ripple has overcome a critical resistance level and flipped into a support floor on the weekly time frame. This development happened while XRP tightly consolidated for roughly 250 days. Investors can expect XRP to kickstart a massive rally.
Optimism price outlook with nearly $90 million worth of OP tokens flooding markets on Friday
Optimism volatility has shrunk in the ours leading to the network’s cliff unlock. It joins the likes of dYdX and Sui, which have similar events on their calendars. As token unlocks are often considered bearish catalysts, investors should brace for a reaction after the event.
Top 3 Price Prediction Bitcoin, Ethereum, Ripple: Retail watches from the sidelines with a bias for shorts
Bitcoin could clear $73,777 peak as BTC bulls resurface. Ethereum might fall 10% before next leg up as ETH RSI teases with sell signal. XRP could lose $0.6000 threshold as Ripple bulls fail to show up.
Jito price could hit $6 as JTO coils up inside this bullish pattern
Jito price action shows a potential cup and handle formation. Based on theoretical measurement rules, a successful breakout could yield a 56% rally to $6.0. A breakdown of the $3.86 support level would create a lower low for JTO and invalidate the bullish thesis.
Bitcoin: BTC may have recovered, but is it out of the woods?
Bitcoin’s (BTC) upward momentum has shown a significant decline for the past two weeks or so. This development led to a bearish signal on the weekly and an uncertain outlook on the monthly.