Bitcoin bears eye catastrophic crash as BTC sellers target $29,000 next
- Bitcoin price could continue trending lower as buyers refuse to enter the market.
- The bearish target given by the governing technical pattern is at $29,026.
- The bulls may find it difficult to reverse the period of underperformance as many obstacles may emerge.

Bitcoin price action has continued to weaken as BTC has dropped below a crucial level of support. The prevailing chart pattern projects another 16% drop for the leading cryptocurrency.
Bitcoin price awaits 16% nosedive
Bitcoin price has sliced below the lower boundary of the descending parallel channel on January 21, putting a 16% plunge toward $29,026 on the radar.
The first line of defense for Bitcoin price is at the July 25 low at $33,851. Additional footholds may emerge for the bellwether cryptocurrency at $31,973 and $30,151, where the June 27 low and the June 26 low sit, respectively.
If Bitcoin price breaks below the aforementioned levels of support, BTC may eventually tag the bearish target given by the governing technical pattern at $29,026, which coincides with the 127.2% Fibonacci retracement level.
Investors should note that if Bitcoin drops below the aforementioned pessimistic target, BTC may slide even lower to prices not seen since January 2021.
However, if buying pressure increases, Bitcoin price will face immediate resistance at the lower boundary of the prevailing chart pattern at $35,570.
An additional hurdle may emerge at the 78.6% Fibonacci retracement level, coinciding with the middle boundary of the descending parallel channel.
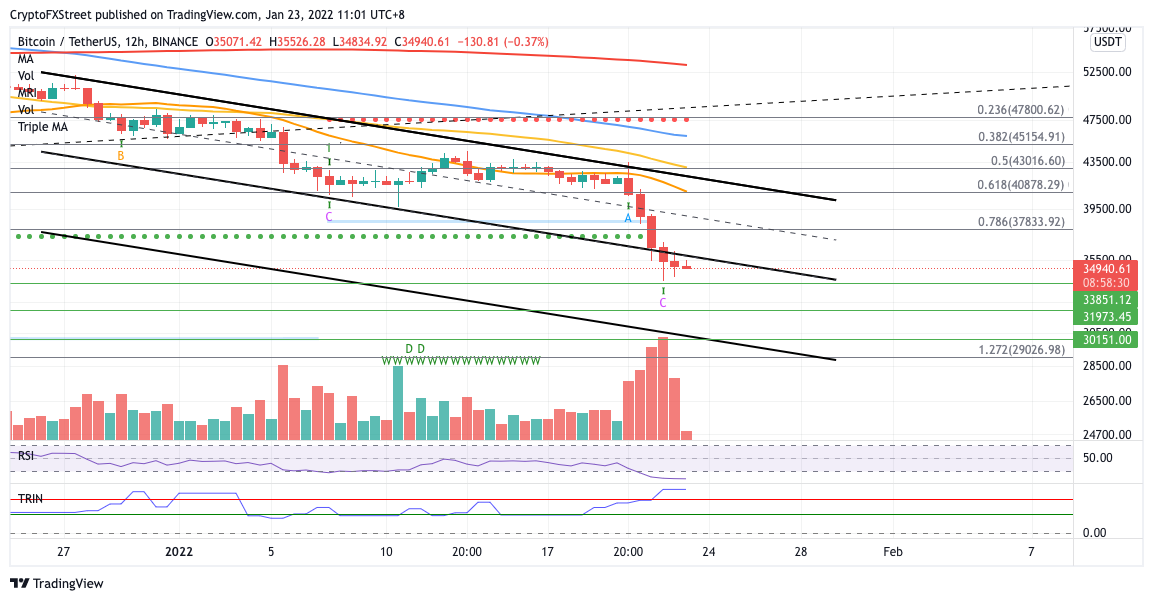
BTC/USDT 12-hour chart
A spike in buy orders may incentivize Bitcoin to tag the upper boundary of the prevailing chart pattern next at $40,878, where the 61.8% Fibonacci retracement and 21 twelve-hour Simple Moving Average (SMA) intersect.
Bigger aspirations will target an escape above the topside trend line of the descending parallel channel pattern, but multiple obstacles may appear, first at the 50% retracement level at $43,016, coinciding with the 50 twelve-hour SMA, then at the 38.2% Fibonacci retracement level at $45,154.
Author

Sarah Tran
Independent Analyst
Sarah has closely followed the growth of blockchain technology and its adoption since 2016.



