Bitcoin: Another buy chance or end of bull market?

What happened to Bitcoin?
Bitcoin became an official currency in Salvador. The Bitcoin Law (Spanish: Ley Bitcoin) was passed by the Legislative Assembly of El Salvador on June 8, 2021, giving the cryptocurrency bitcoin the status of legal tender within El Salvador after September 7, 2021.
El Salvador bought its first 400 bitcoins on Monday, which was equal to $20 million. President Nayib Bukele pledged to buy "a lot more" ahead of adopting the cryptocurrency as legal tender.
Members of the highly famous Reddit forum called for a $30 worth of Bitcoin purchase to support Salvador’s president's decision.
But as the famous proverb says: “buy the rumors, sell the news”. Bitcoin dropped from $52 000 to $43 000 in three hours and many positions got liquidated.
Technical analysis for BTC
In this article we will look at the Bitcoin logarithmic and Bitcoin domination charts, discuss the Bitcoin rainbow theory and look at the usual chart to predict an upcoming price movement.
The first thing you need to do to become a successful trader is to defy the market trend. Let’s start with it!
Bitcoin logarithmic monthly chart
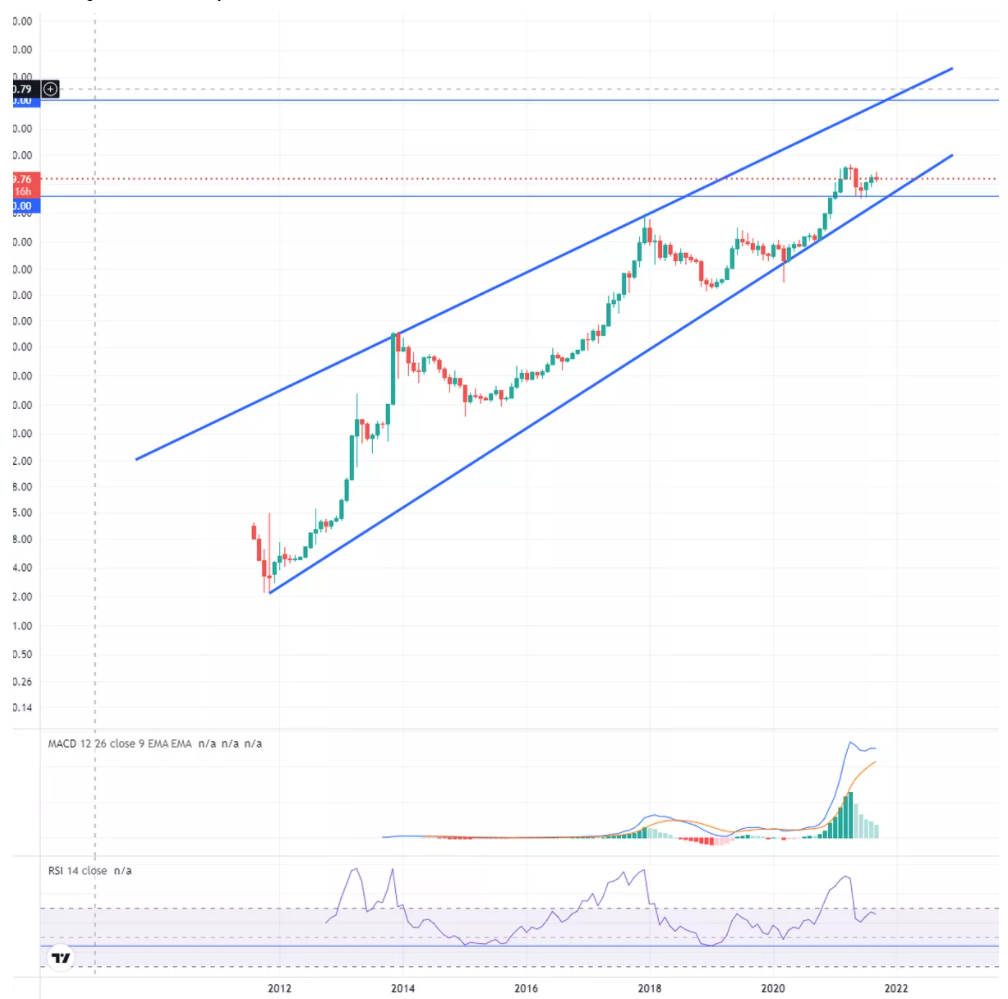
Bitcoin logarithmic chart is used by crypto traders to define a potential trade reversal. As you can see, the RSI oscillator didn’t return to its normal meaning (which is 44) and the MACD indicator shows the potential trend reversal. These facts tell us that the correction is not over, and Bitcoin might return to the bottom line of the channel, which is $30 000. If crypto-asset bounces back from this level a “double bottom” pattern will be drawn, and the massive bull run will begin.
Bitcoin dominance monthly chart

The dominance chart presents the Bitcoin attitude with all other cryptocurrencies. It is very useful for” alt-coin” season prediction. If the price goes down, altcoins are growing faster than the main crypto asset. Otherwise, when the price rises Bitcoin drops slower than altcoins do.
According to the chart, we can see that it reached the bottom and trying to reverse. As mentioned above it means that in the mid-term Bitcoin might fall and altcoins season is over.
Bitcoin rainbow theory chart
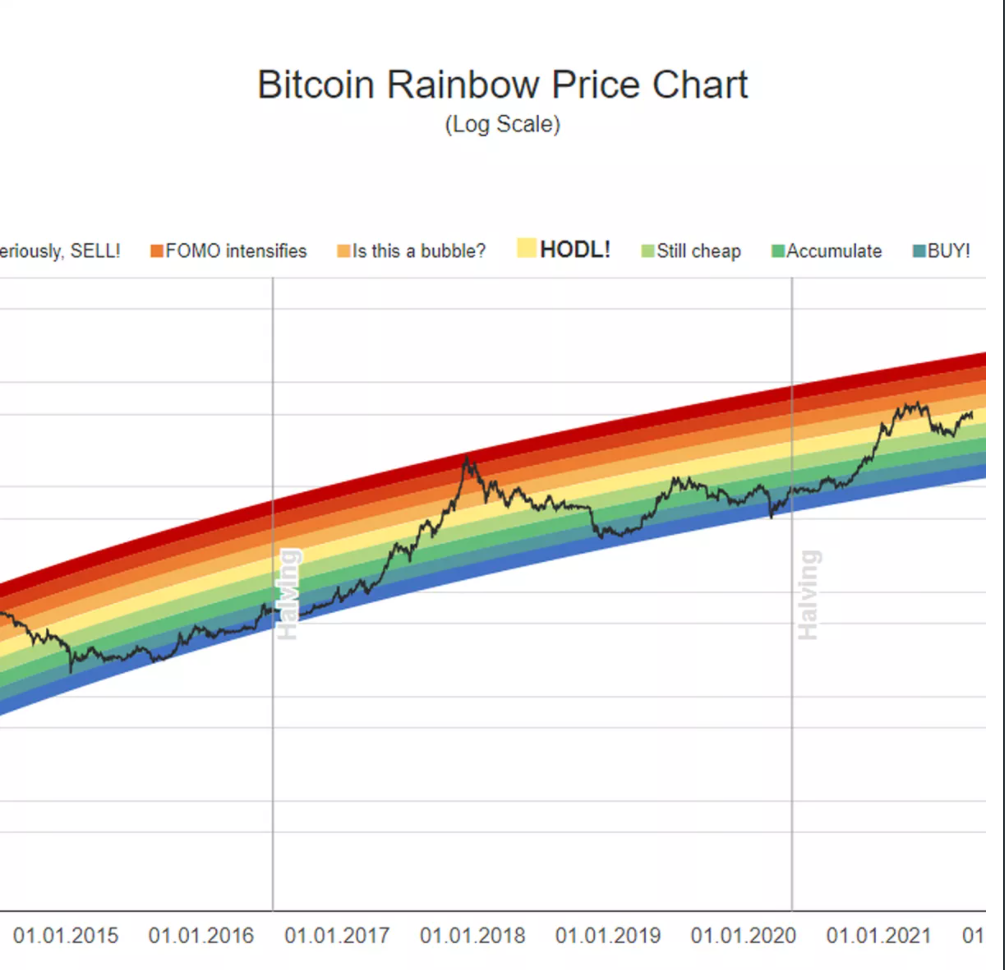
According to this chart, after every halving Bitcoin reaches the upper (red) line of the rainbow. It didn’t reach this range after the last halving, so traders expect it to happen. The target varies from $150 000 to $200 000 depending on what time it will reach the red color.
Bitcoin daily chart
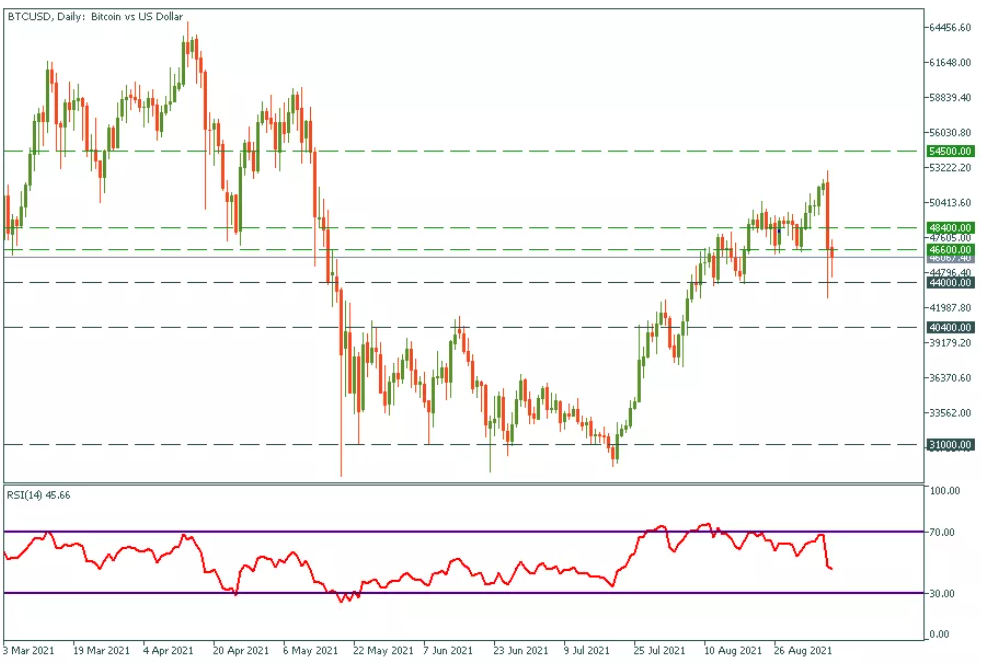
As we can see on Bitcoin's daily chart, the price and the RSI round off, which is a bad sign. Nevertheless, we can notice that buyers became active, and they are trying to push the price above the $46 600 level. If they make it by the end of September 8, we might see a tiny pullback up to the $48 500 - $49 000 range. If the Bitcoin price doesn’t renew the local high at $52 000 and returns to the $46 600 price level, the breakout of this level will set the targets at $40 400 and $31 000.
Bitcoin 1h chart
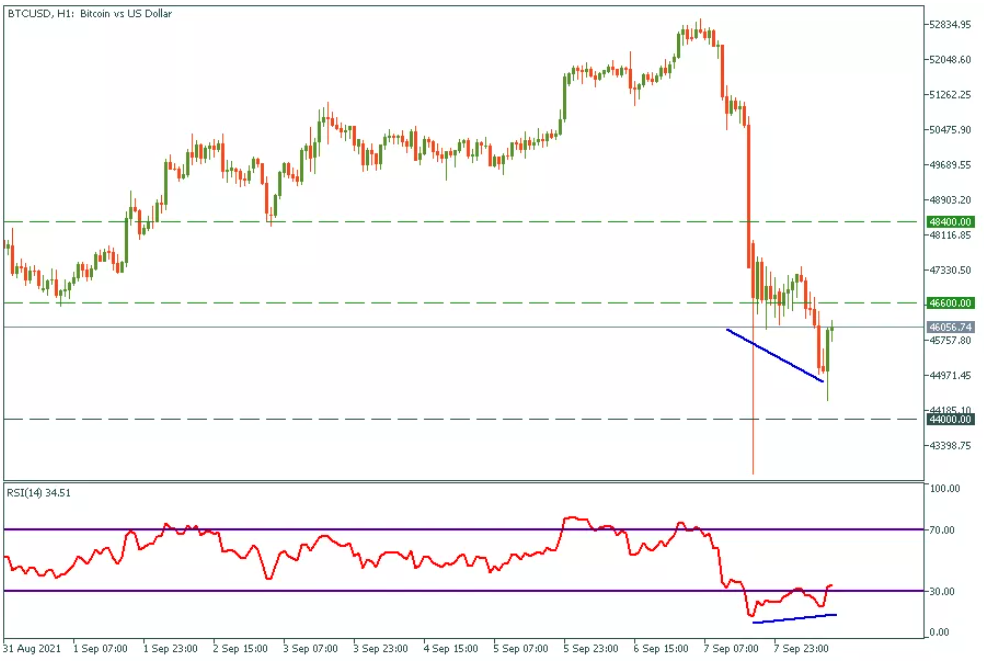
Bitcoin price has a divergence with the RSI on the H1 chart. The price might pull back to the $46 600 level and if it breaks through it might reach the $48 400 - $49 000 range.
Conclusion
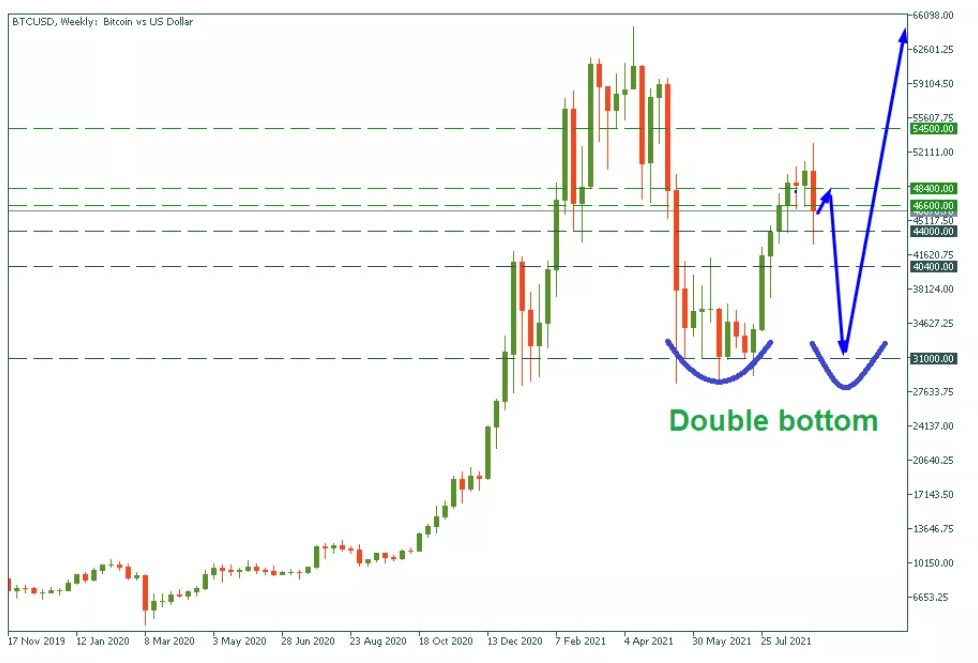
We expect Bitcoin to pull back up to $49 000 and drop down after back to $30 000 - $35 000, where it will draw a reversal pattern (it might be a double bottom pattern) and surge to the all-time high at $150 000 after.
Bitcoin weekly chart
Author

FBS Team
FBS
FBS team is a group of professional analysts focused on Forex, stock, and commodity markets. Each expert possesses a years-long experience in fundamental and technical analysis.


