Bitcoin and Ripple plunge as crypto market faces heavy liquidations – What's next?

Bearish momentum accelerates as Bitcoin breaks key supports, triggering market-wide sell-off
Bitcoin (BTC/USD) collapsed from its 96400 impact zone on February 24, 2025, taking out four major support levels in just three days. The long liquidation wave intensified, with $389.96 million wiped from Bitcoin positions alone in the last 24 hours, followed by Ethereum ($97.67M), Solana ($21.87M), Ripple ($10.18M), and Dogecoin ($7.74M), according to Coinglass.
Several factors contributed to Bitcoin's sharp decline, including the $1.5 billion Bybit Ethereum cold wallet breach, uncertainty over President Trump's slow rollout of pro-crypto policies, and concerns over impending tariffs. Additionally, significant Bitcoin ETF outflows and a broader risk-asset sell-off dragged down market sentiment. Traditional financial markets also saw heavy losses, with major indices—including the S&P 500, Nasdaq 100, Dow Jones, and Russell 2000—experiencing sharp declines.
Bitcoin's breakdown: From $96,400 to $84,781 in four days
Bitcoin had been consolidating since mid-January, forming a symmetrical triangle pattern. As highlighted in our previous analysis, a breakdown was imminent, and the Bybit security breach acted as the catalyst. Once Bitcoin lost the crucial $90,320 support level on February 25, selling pressure escalated, triggering mass liquidations.
On February 26, Bitcoin hit its first downside target at $87,200, with further pressure pushing it toward $81,900. As of February 27, Bitcoin trades at $84,781, marking a $11,619 drop from $96,400 (-12%) and a staggering $24,219 decline from its all-time high of $109,000 (-22.2%) in January 2025.
Bitcoin is now in a technical bear market, falling over 20% from its peak. The $84,200 support zone may offer temporary relief, but if bears maintain control, Bitcoin could test $81,900 and $75,884 in the coming days. Bulls must reclaim $90,320 to shift the momentum back in their favour.
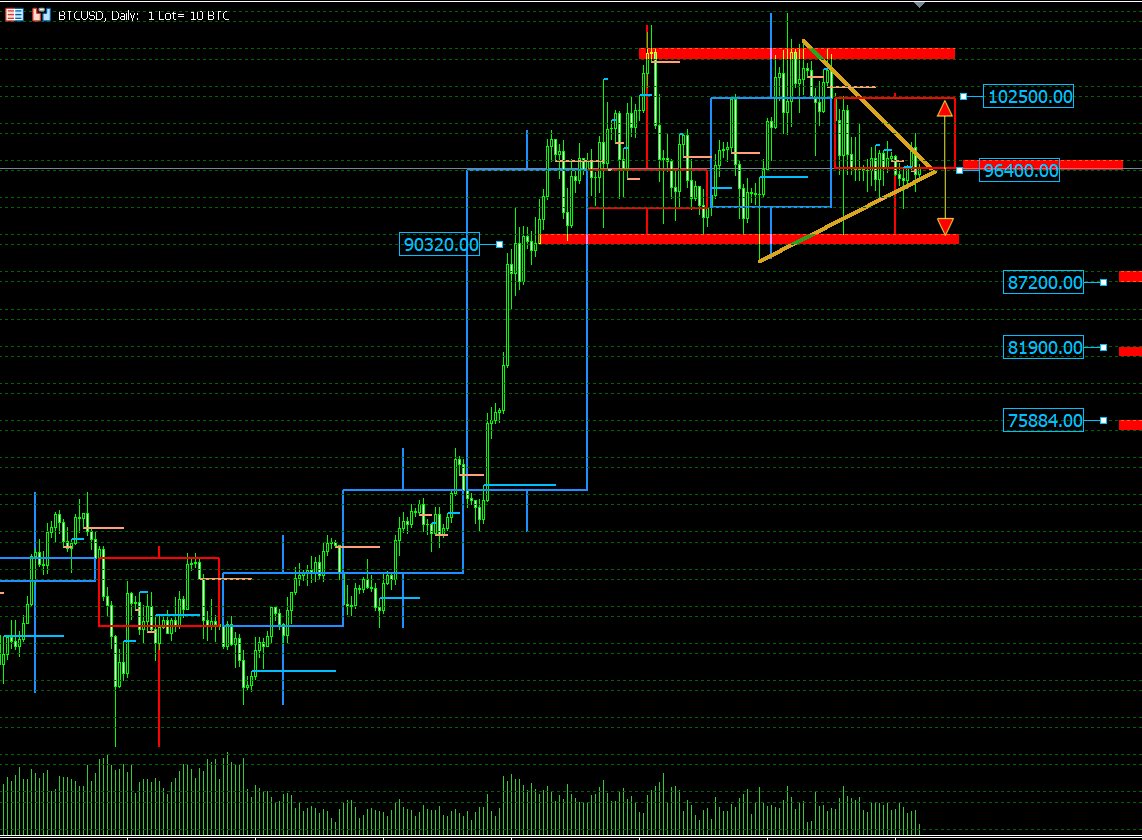
Bitcoin chart on February 24 2025 analysis, highlighting the 96400 impact zone
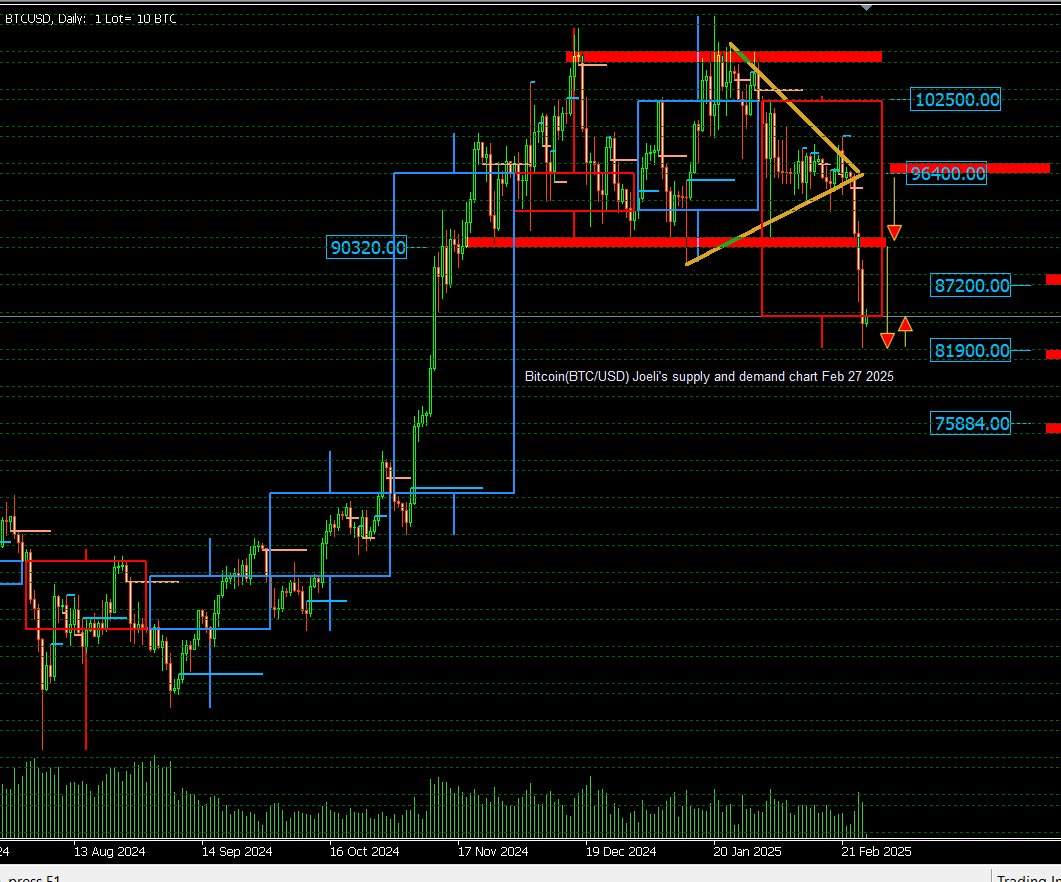
Bitcoin price chart update February 27 2025
Ripple (XRP/USD) mirrors Bitcoin's sell-off
Ripple (XRP/USD) followed Bitcoin's trajectory, mirroring the same breakout structure. After struggling below the $3.36 resistance since mid-January, XRP collapsed at its $2.60 breakout point on February 24, piercing two major support levels in three days.
As of February 27, XRP trades at $2.18, reflecting a $0.42 drop (-16.15%) from $2.60 and a $1.22 decline (-35.88%) from its $3.40 all-time high in January 2025.
With regulatory uncertainty, security breaches, and macroeconomic headwinds weighing on sentiment, XRP faces a critical battle at the $2.00 support zone. A break below this level could send prices tumbling toward $1.84 and potentially lower.
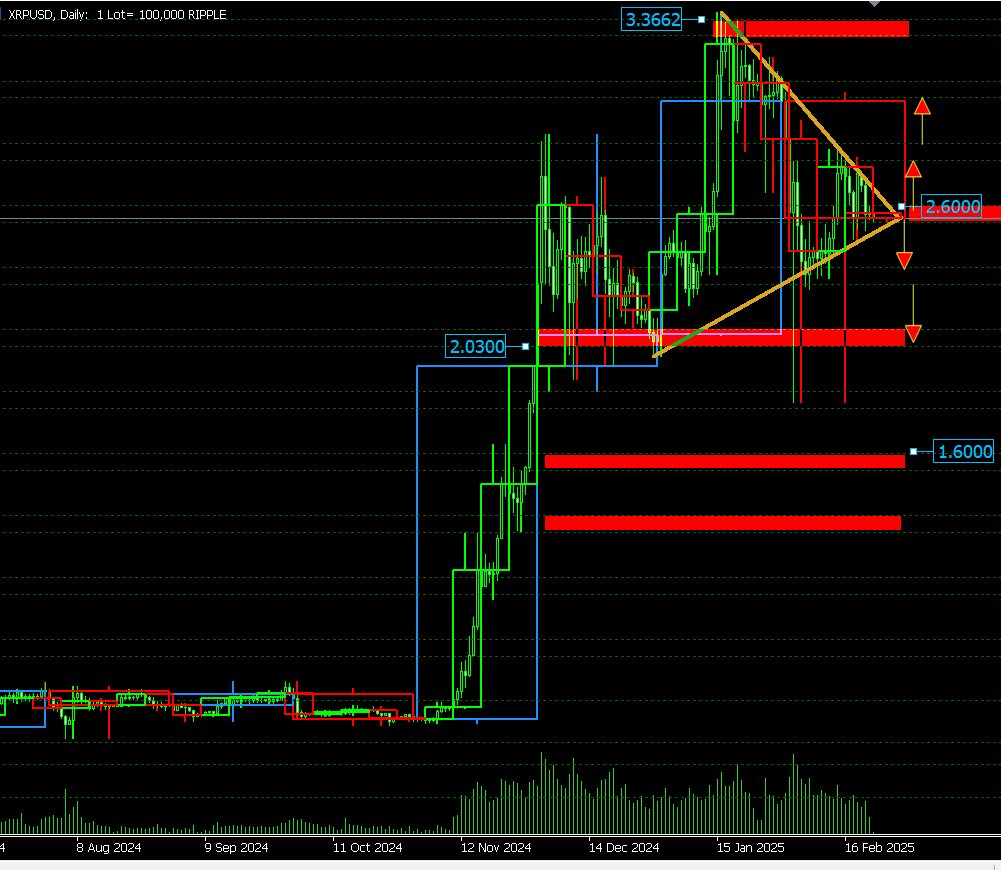
Ripple price chart analysis on February 24 2025, highlighting the 2.60 impact point
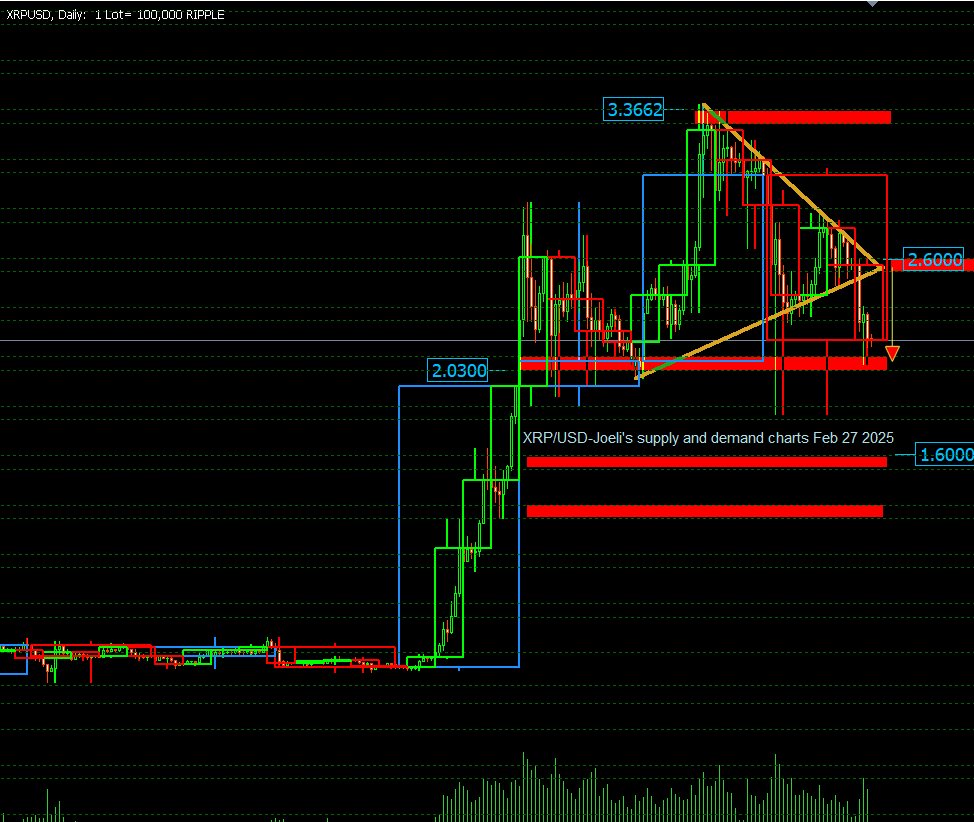
Ripple price chart update February 27 2025.
Final Thoughts: Will Bitcoin and Ripple Find Support or Extend Losses?
The crypto market is under immense pressure, with cascading liquidations, security breaches, and regulatory concerns amplifying the sell-off. While $84,200 (BTC) and $2.00 (XRP) are key support levels, failure to hold these zones could drive deeper corrections. Bulls need to reclaim lost ground quickly to prevent a prolonged bearish cycle.
The coming days will be decisive—will Bitcoin and Ripple stabilize, or will sellers tighten their grip?
Author

Denis Joeli Fatiaki
Independent Analyst
Denis Joeli Fatiaki possesses over a decade of extensive experience as a multi-asset trader and Market Strategist.


