Bitcoin and Ethereum price tumble, but the bull run remains intact
- Bitcoin price continues to reaffirm its upside potential, but it seems poised for further lows.
- Ethereum price appears to be highly correlated to Bitcoin as it looks primed for a pullback before $800.

The correlation in Bitcoin and Ethereum price has been maintained over the past few weeks as both have recorded 7% and 11% loss respectively in the last seven days. A significant movement of the former in either direction has always been replicated by the latter.
Bitcoin price to pull back before new all-time highs
The appearance of higher lows on Bitcoin's long-term price chart continues to signal a bullish trend but first, a possible further downward move cannot be overlooked.
After failing to reclaim its previous all-time high of $19,000, Bitcoin now sits at $18,030. One critical zone which stands out on the weekly chart is $16,200. This could form a significant support level as the price broke above the line and retested before making a run for its former highs. A potential pullback to this point may see sufficient buy pressure to sustain it, thereby warding away the bears.
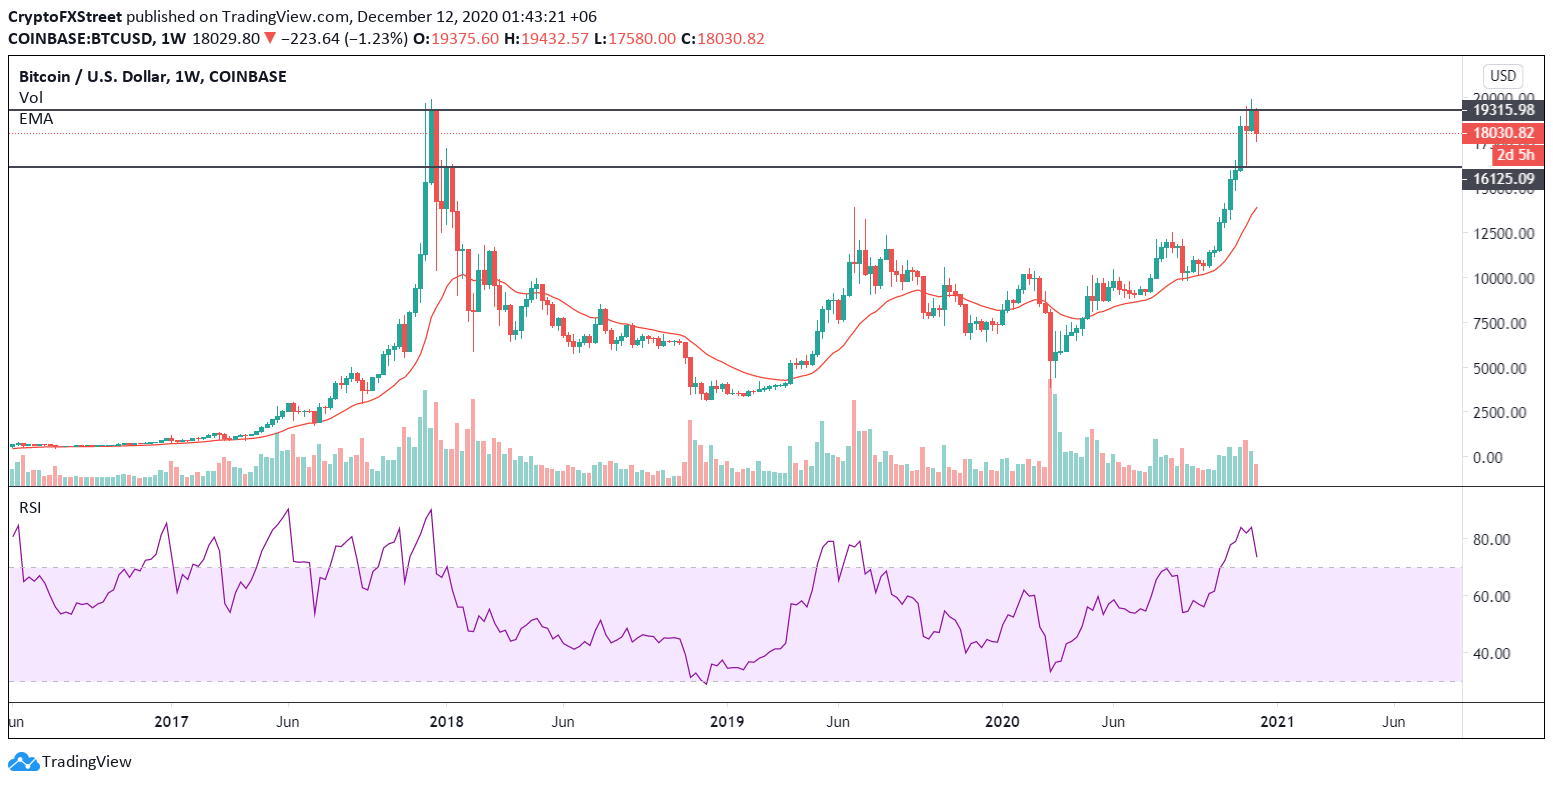
BTC/USD weekly chart
Slicing through this potential support may open the gateway for lower prices as investors could expect to see the flagship cryptocurrency plummet to $13,500. A decline in these price levels could present a perfect buying opportunity for market participants. It might make another bounce off on the 21-day moving average, which it seems to respect as shown on September 28.
Ethereum price trend keeps signaling a potential upswing
The weekly chart continues to suggest that Ethereum’s bullish case still holds from a macro standpoint. A key supply zone to look out for is $618. The formation of new higher highs and higher lows has sent prices back up to this key level which has now become a strong hurdle for the smart contract token to surpass.
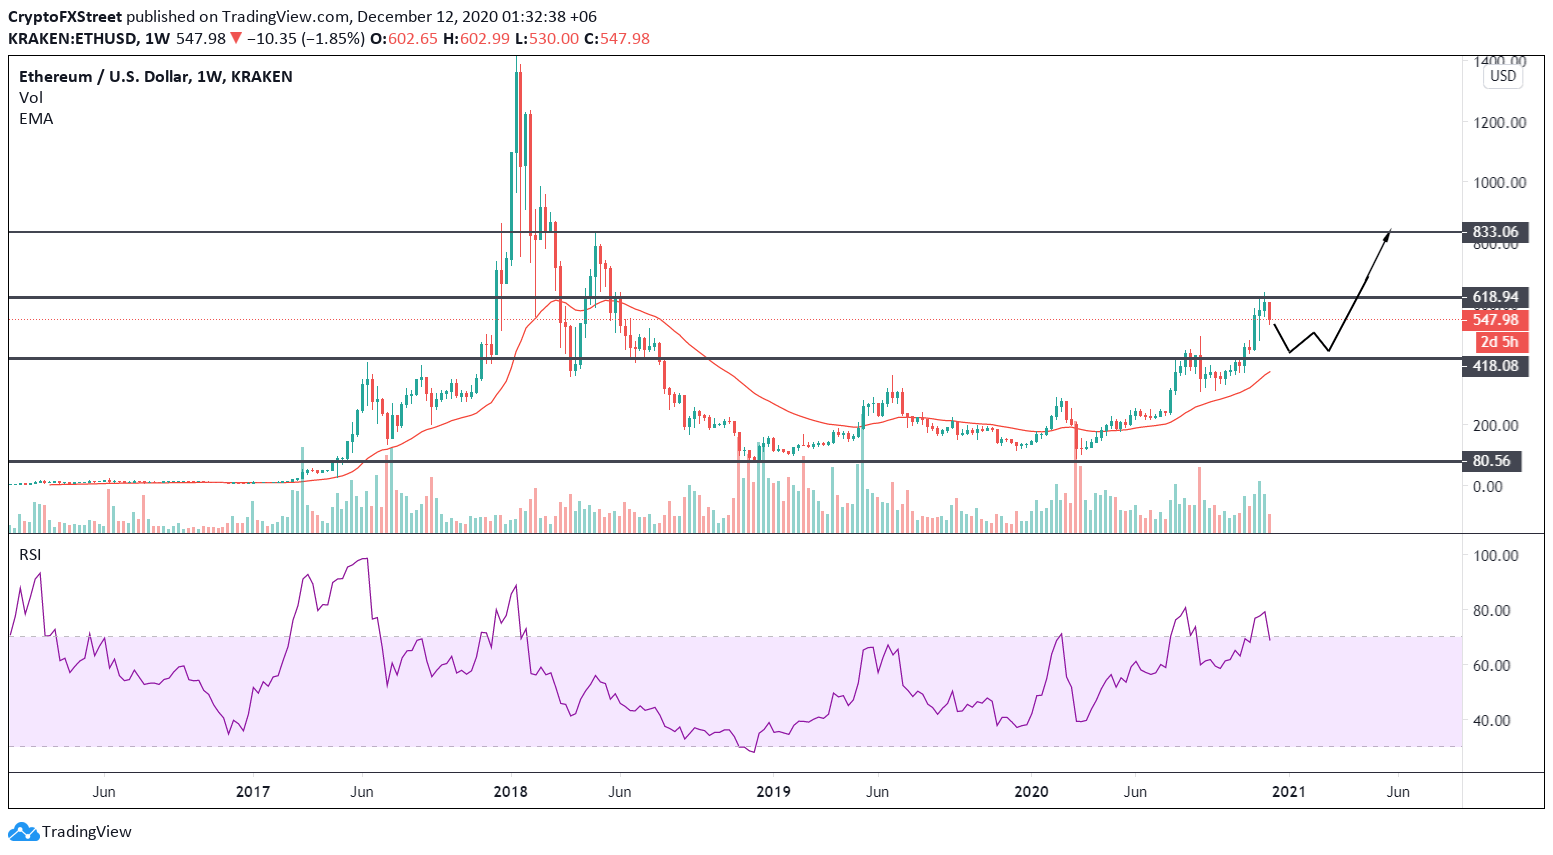
ETH/USD weekly chart
Multiple rejections seen at this line from November 23 to date have sent Ethereum price to where it trades at $549. Market participants should expect an extension of this healthy correction as a pullback to $418 should provide sufficient momentum for an upthrust to $800.
Author
FXStreet Team
FXStreet
Composed of a group of economic journalists and FX experts, the FXStreet content team produces and oversees all content published on FXStreet. It provides a purely journalistic approach to the Forex market.


