Bitcoin and Altcoin Post-Rally Trade

How investors should set up their trade after the October rally? Are we getting a price correction?
Overview
The prices of bitcoin have been consolidating at above 9000 levels after the rally in late October with a backdrop of blockchain-friendly policy from China and a new all-time high from the SPX. As we wrapping up October, where will bitcoin and broader crypto markets will go from here? While bitcoin may have most of the market focuses, data shows that altcoin could be reaching a critical level as well, how traders and investors should set up their trades as we approach year-end.
Bitcoin: Gap to Fill
It was a happy week so far for bitcoin traders as the leading cryptocurrency posted one of the biggest daily gains in history during the last weekend of October. We’ve explained that a new all-time high in the equities markets could trigger bitcoin to turn from a digital gold risk-off asset mode to a risk-on asset mode. While some traders could have taken profit from the recent rally, many could have wondered how to set up the next trade. Perhaps institutional bitcoin traders could provide some insights.
The chart below shows the CME Bitcoin Futures' year-to-date performance. The yellow circles are the major gaps that we’ve seen this year, and the green arrows indicate where the gap got filled.
Figure 1: CME Bitcoin Futures Daily Chart, YTD
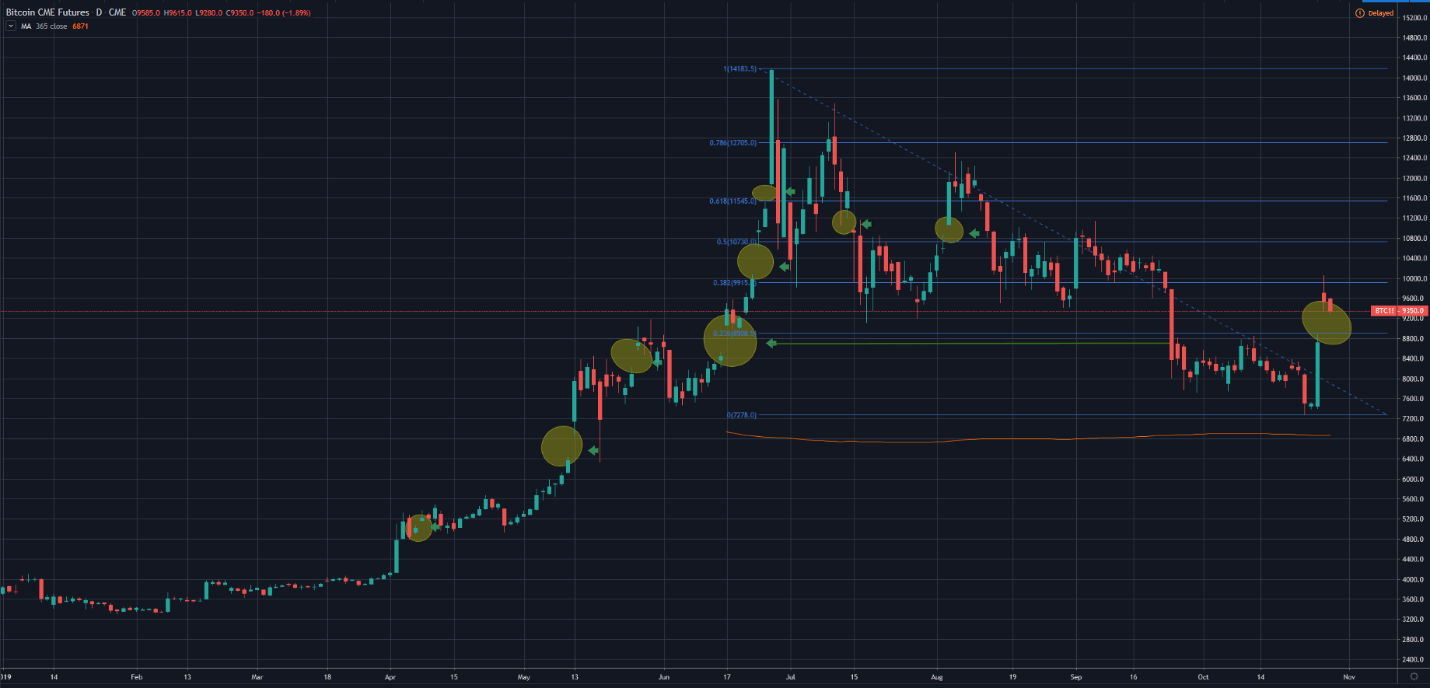
(Source: Tradingview)
So, what are gaps? Gaps are areas on a chart where the price of an asset moves sharply up or down, with no trading in between. Therefore, the asset's chart shows a gap. Filling a gap means the price must move back to the original pre-gap level. Filling gaps could happen because of historic price patterns, technical resistance or support, or simply a correction of the earlier irrational price movements.
In the case of BTC, most of the gaps in the CME BTC Futures this year got filled within days after the gap was produced. So far, only the June 17 gap is an exception, which came at the time before bitcoin surged to 14400 levels, and the gap ultimately got filled in late September.
Bitcoin’s October rally also produced a huge breakaway gap which shown on the far right side in figure 1. If history repeats itself, the October gap will likely be filled although the timing could be hard to determine. However, we believe that the rally would be healthier and more sustainable if the gap got filled before starting a new trend.
It’s worth noting that the bitcoin initially attempted but failed to stay above the 38.2% Fibonacci Retracement at around 9915 levels, which indicates that the chance of bitcoin retesting the support back at the 23.6% FR levels near 8908 is still viable, and that will eventually fill the gap.
Figure 2: CME Bitcoin Futures CoT Summary
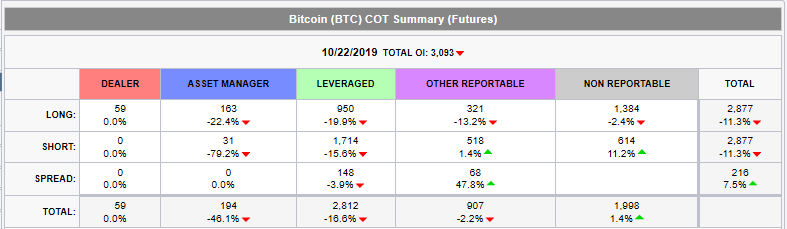
(Source: CME)
Moreover, data from CME’s Commitment of Traders shows that asset managers’ bitcoin long positions declined last week after three consecutive weekly increases. However, the summary only shows the changes in positions before the bitcoin rally, so it could be less significant than it supposed to be, but it will be interesting to compare the setups and position changes of institutional investors before and after the bitcoin October surge.
Key Moment for Altcoin
Altcoin is an interesting area to watch as the bitcoin October rally has led the total altcoin market value to a critical moment, and it could be the moment of truth on whether a real beginning of an “Altcoin Season”.
Figure 3: Crypto Total Market Cap Ex-BTC
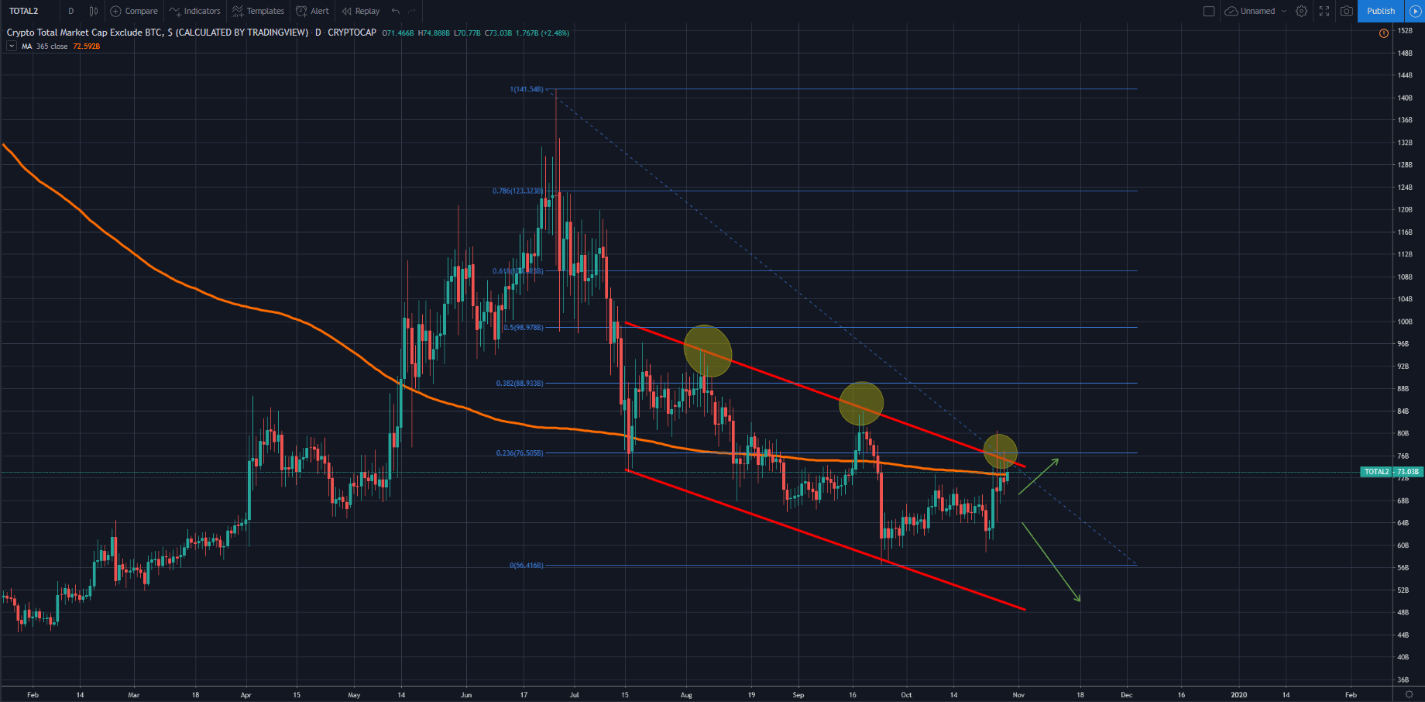
(Source: Tradingview)
Figure 3 shows the total crypto ex-btc market cap and it has been in the downward channel since mid-July. In our October publication < Altcoin Season: To Be or Not to Be?>, we’ve studied that it would be premature to make the call of the start of “Altcoin Season” during the September and October altcoin rallies. That’s because the altcoin market cap still largely remained in a downward channel and failed to stay above the 365-day moving average (orange line).
After the latest bitcoin rally, the altcoin market cap seems to make its third attempt to break the channel and retest the 365-day moving average. It’s worth noting that the upper end of the channel is also where the 23.6% Fibonacci Retracement lies, so altcoin traders would especially focus on the development in this area and see if it can produce a breakout.
However, if bitcoin continues to consolidate at the current level, or a gap-filling correction is due, that could strengthen the downside bias in the altcoin space.
Figure 4: OKEx’s BCH Long/Short Ratio
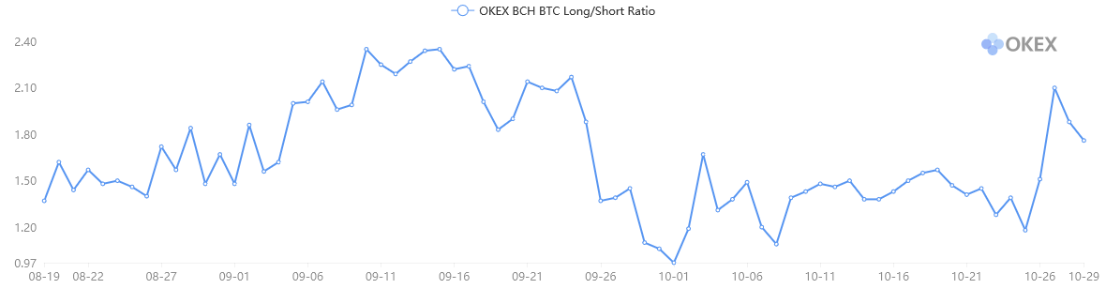
(Source: OKEx)
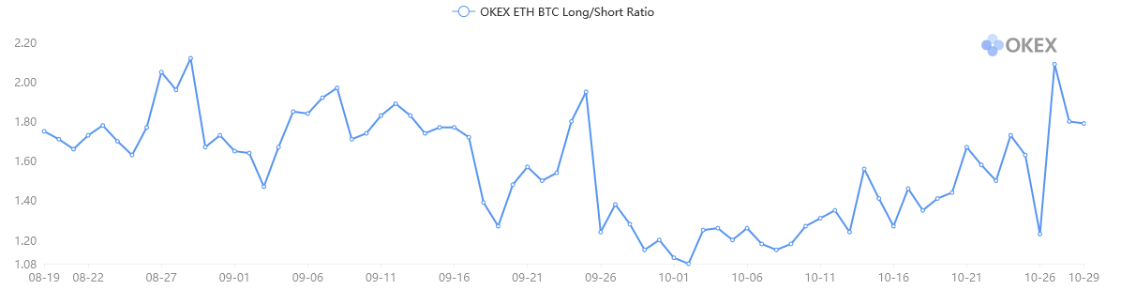
Figure 5: OKEx’s ETH Long/Short Ratio
(Source: OKEx)
Additionally, data from OKEx’s futures trading platform shows that the potential profit in some of the altcoin short positions have been increasing despite the number of long traders have been rising. The case in BCH and ETH was especially noticeable, as their Long/Short Ratio still relatively high.
What’s the Setup?
Diversification has always been one of the most important strategies when it comes to trading, regardless of whether you are a long-term HODLer or a short-term day trader. In the short-term, we expect to see more traders in favor of short positions, especially in the BCH and BSV area. Also, some other major altcoins that already outperformed bitcoin, could draw more short interests as well. Over the medium-long term, we believe HODLers would still favor bitcoin over altcoin, and long call or short put position will able to create a stronger bullish position. Investors can always use the information from OKEx’s Trading Data to gauge market sentiments and the real trade volume of OKEx derivatives trading platform.
Conclusion
We have shown how investors can use OKEx’s Futures and Swap products and data to add value to trading, especially at a time that the broad cryptocurrency experienced one of the most significant rallies in history, and diversification could be one of the strategies that able to capture the potential post-rally price movements.
Author

Cyrus Ip
OKEx
Cyrus Ip has the privilege to work with OKEx as a Research Analyst, where he found some of the brightest talents in the crypto space.


