Beyond Crypto Perpetuals: Binance’s Gold XAUT volume hits $6.4B
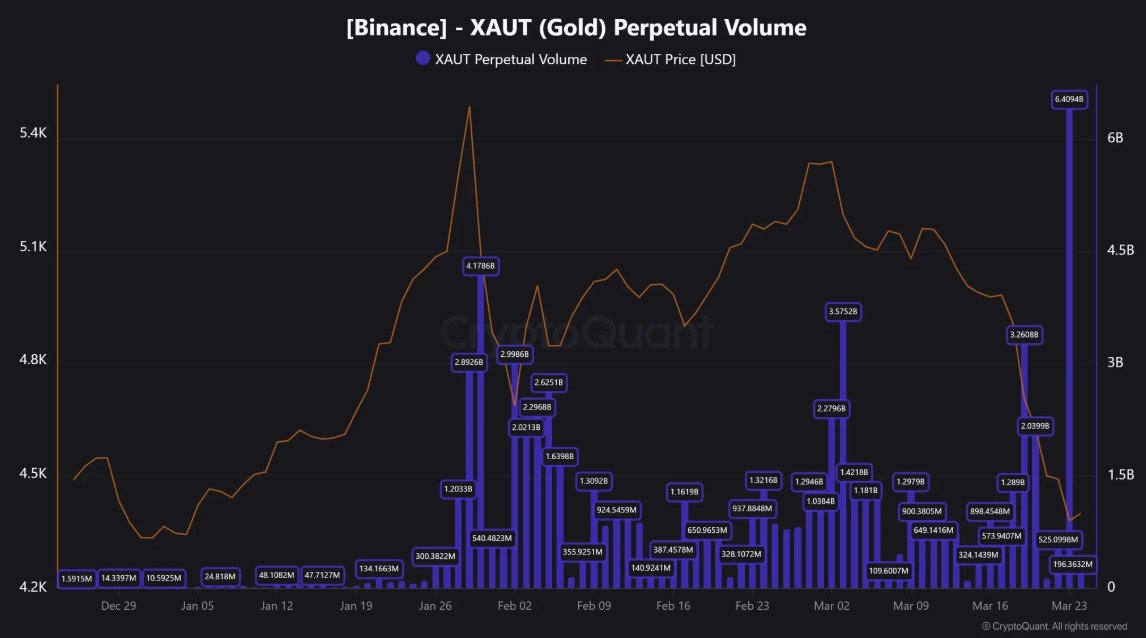
- Binance’s Gold XAUT perpetual contract volume hit a record $6.4 billion on Wednesday.
- The surge in XAUT volume signals growing interest in real-world assets as Binance prepares to launch perpetual contracts for META, NVDA and GOOGL.
- Gold rises above $4,571 after hitting a yearly low of $4,099 on Monday.

The gap between the cryptocurrency market and the traditional finance system appears to be closing fast, as evidenced by Tether Gold XAUT perpetual contract hitting a record $6.4 billion in trading volume on the Binance exchange on Monday.
XAUT perpetual futures volume explodes as traders embrace RWAs
Interest in real-world assets (RWAs) has increasingly grown in 2026, which is reflected by the surge in Gold XAUT perpetual contract volume. From around $1-$2 billion in volume, the partial contract hit a new all-time high of $6.4 billion on Monday and appears to be holding at the same elevated levels, according to CryptoQuant.
The Gold XAUT perpetual contract volume averaged in the mere millions in late 2025, underscoring a paradigm shift toward RWA assets. The Gold XAUT is now the fifth-largest perpetual contract on Binance.
Binance is preparing to launch USDT-settled perpetual futures contracts that will track the stock prices of Meta Platforms (META), Nvidia (NVDA) and Alphabet (GOOGL) on Thursday, adding the three most actively traded stocks globally to its equity derivatives suite.
These contracts will offer investors up to 10x leverage and will be available 24/7, with settlements made in USDT and funding fees charged every eight hours.
Coinbase, Kraken and other crypto exchanges have also launched similar contracts, offering access to tokenized stock products and significantly closing the gap between crypto and traditional finance.
Gold rebounds from yearly lows
Gold is trading around $4,571 at the time of writing on Wednesday. Its near-term bias is cautiously bearish as price holds below the 100-day Exponential Moving Average (EMA) at $4,634 and the 50-day EMA at $4,853.
Meanwhile, the Moving Average Convergence Divergence (MACD) remains below its signal line and well below the neutral area on the daily chart, with a persistently negative histogram that reinforces the prevailing downside momentum. At the same time, the Relative Strength Index (RSI) has recovered from oversold readings near 27 to the mid-30s on the same chart, suggesting fading selling pressure but not yet a convincing shift back to bullish control.
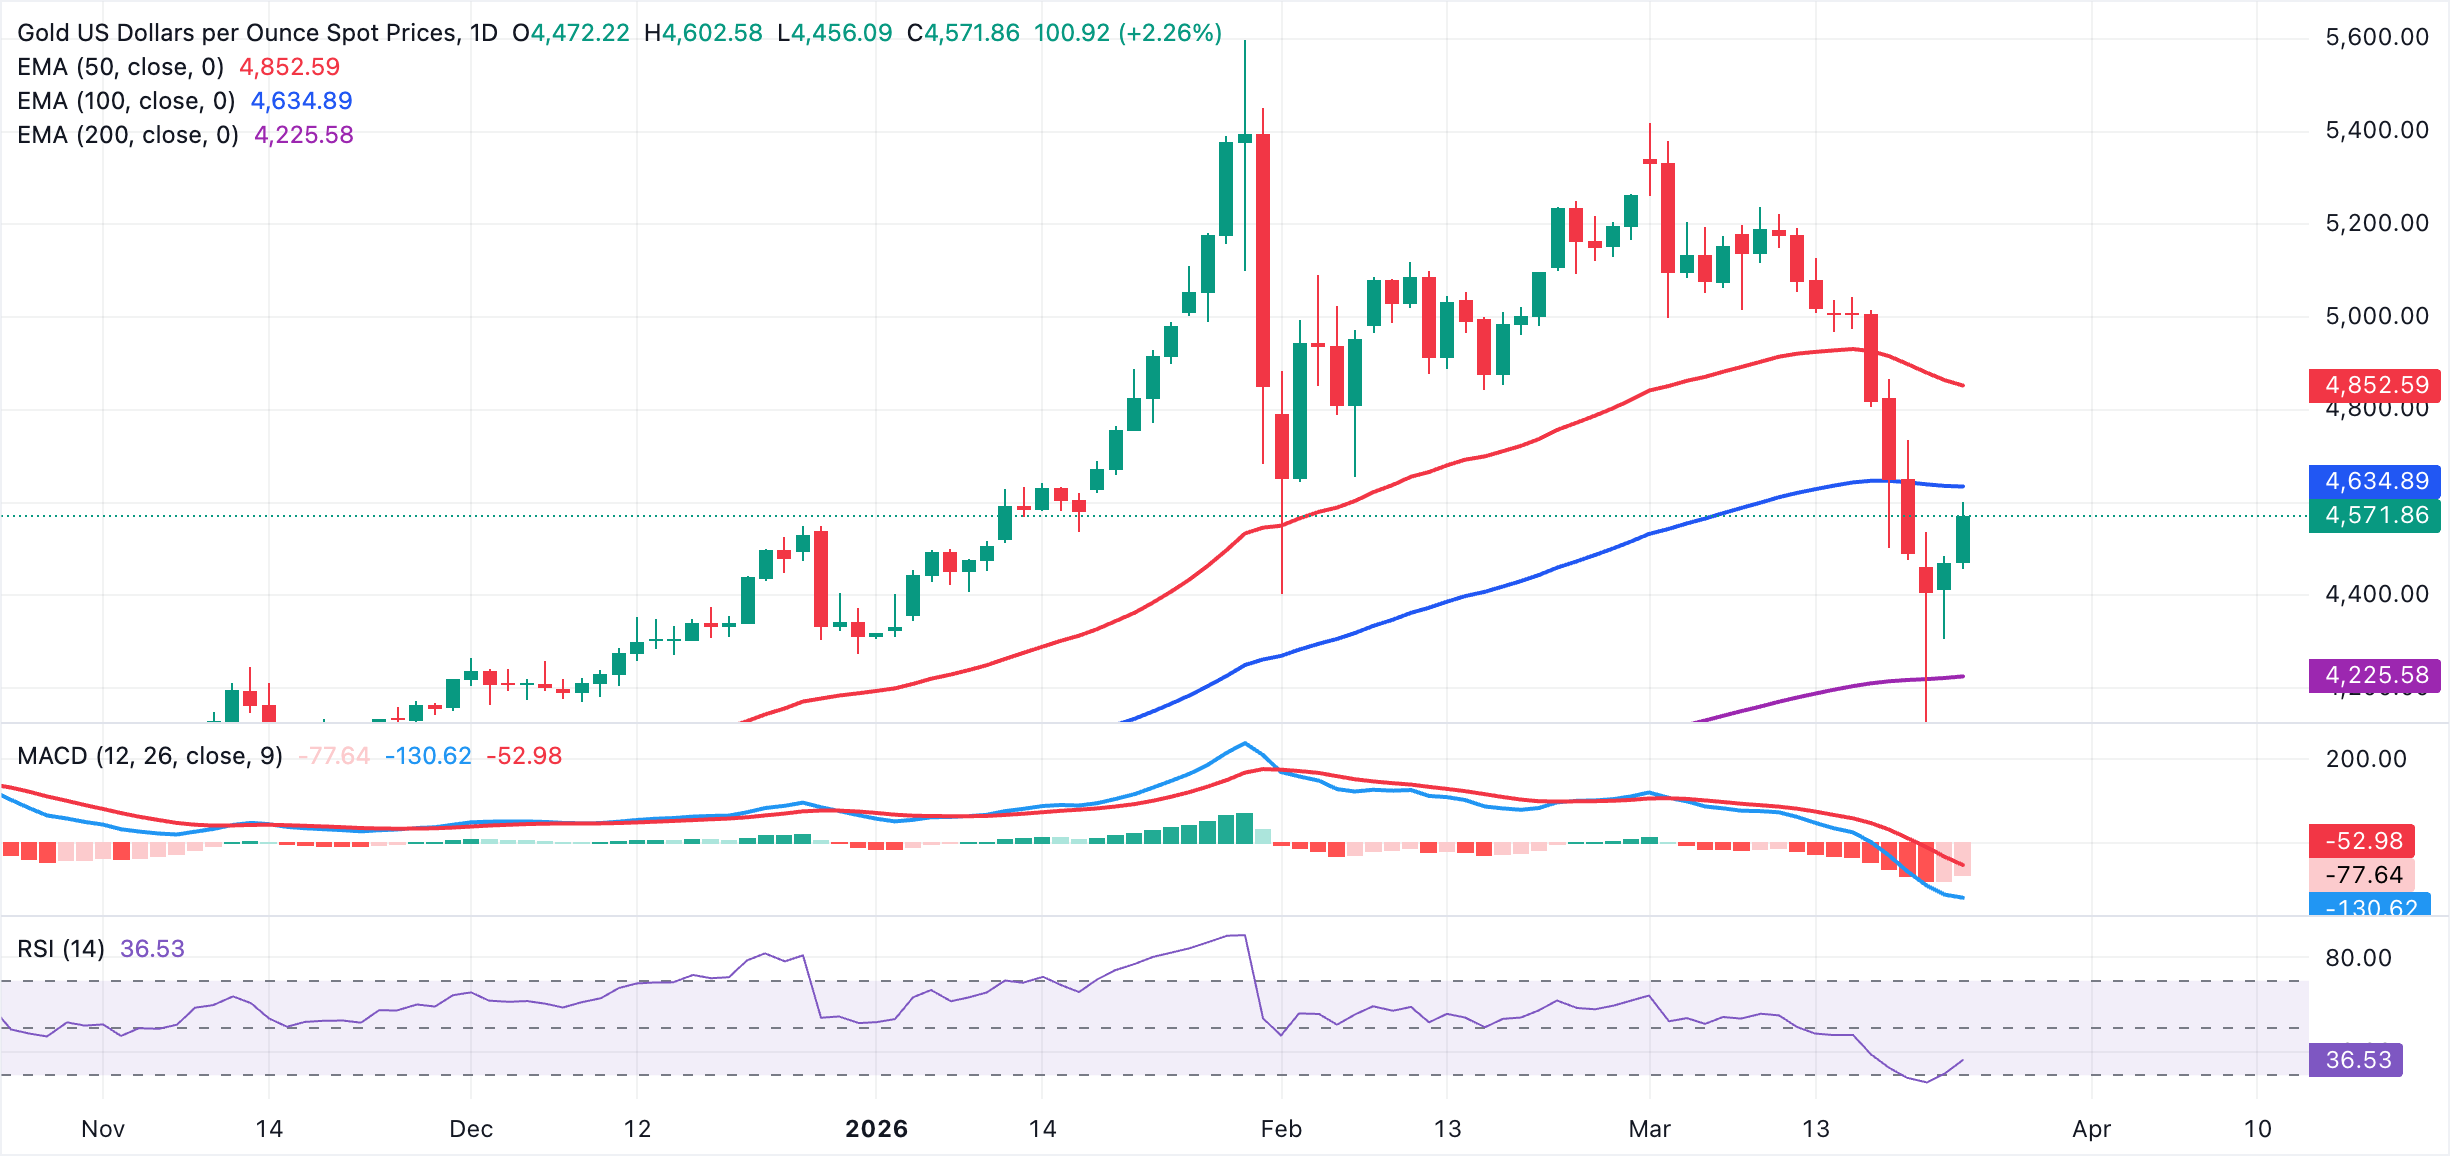
Immediate resistance emerges at the 100-day EMA around $4,635, followed by the 50-day EMA at $4,853. A daily close above the latter supply zone would open the way toward $5,000 as the next upside barrier. On the downside, initial support lies at $4,456, which is Gold's daily low and where a break could expose deeper bearish targets.
Open Interest, funding rate FAQs
Higher Open Interest is associated with higher liquidity and new capital inflow to the market. This is considered the equivalent of increase in efficiency and the ongoing trend continues. When Open Interest decreases, it is considered a sign of liquidation in the market, investors are leaving and the overall demand for an asset is on a decline, fueling a bearish sentiment among investors.
Funding fees bridge the difference between spot prices and prices of futures contracts of an asset by increasing liquidation risks faced by traders. A consistently high and positive funding rate implies there is a bullish sentiment among market participants and there is an expectation of a price hike. A consistently negative funding rate for an asset implies a bearish sentiment, indicating that traders expect the cryptocurrency’s price to fall and a bearish trend reversal is likely to occur.
(The technical analysis of this story was written with the help of an AI tool.)
Author

John Isige
FXStreet
John Isige is a seasoned cryptocurrency journalist and markets analyst committed to delivering high-quality, actionable insights tailored to traders, investors, and crypto enthusiasts. He enjoys deep dives into emerging Web3 tren