Pi Network Price Forecast: PI hits record low as bearish pressure overwhelms rebound hopes
- Pi Network hits a record low, down over 5% so far on Monday, extending the previous day’s 6% decline.
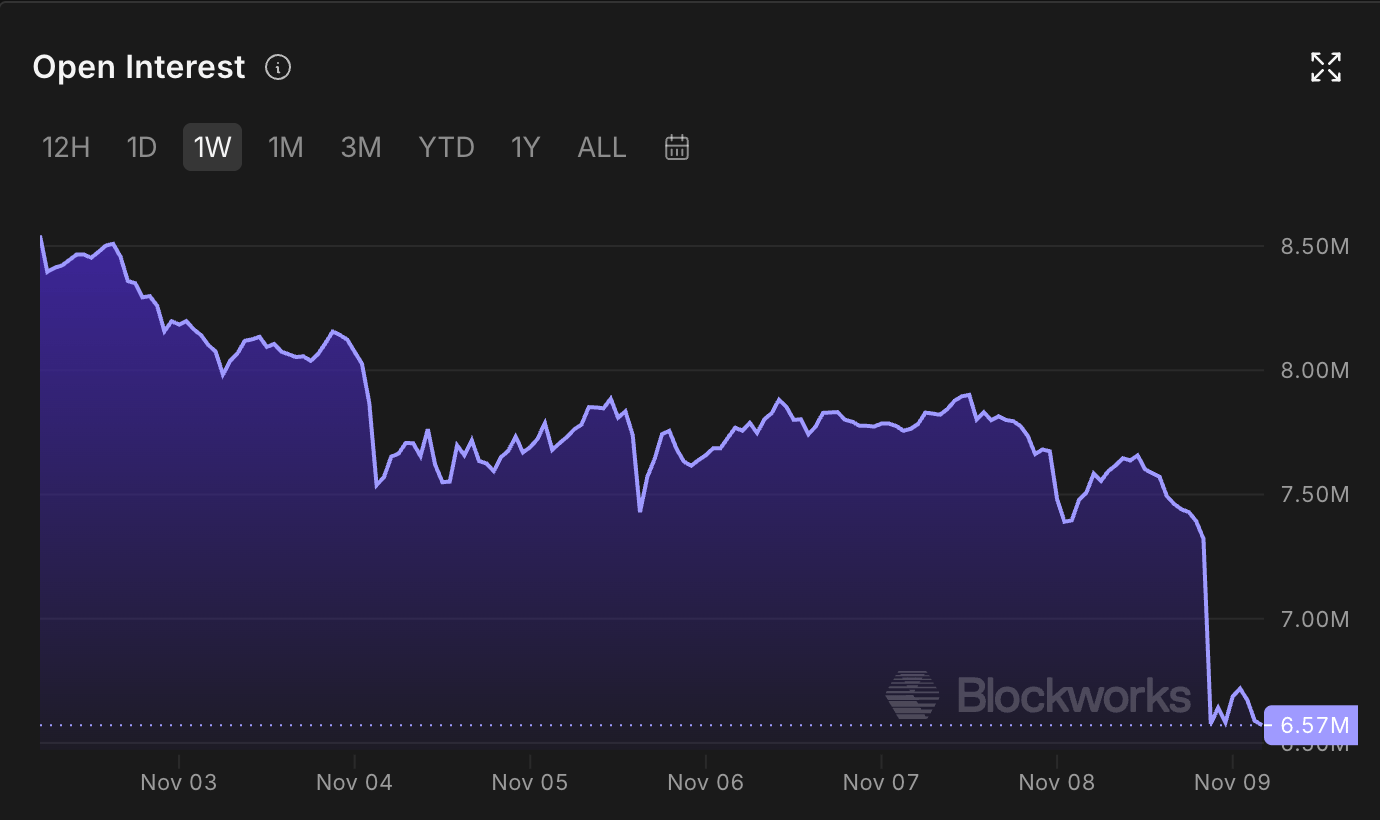
- PI Open Interest drops to $6.57 million, from $8.54 million last week, suggesting a positional wipeout.
- The technical outlook for the PI token is bearish, with selling pressure remaining firm despite oversold conditions.

Pi Network (PI) is trading at a record low, with over 5% losses so far on Monday, following the previous day’s 6% decline. The PI token's retail appeal also takes a hit, with its Open Interest down by over 20% in a week, indicating a large-scale unwinding of active positions. The technical outlook for PI is bearish as the downside momentum persists despite oversold conditions.
PI retail support declines
Pi Network is losing retail support as broader crypto market sentiment falters amid uncertainty following the US midterm results. Blockworks data shows that the PI Open Interest (OI) has dropped to $6.57 million on Monday, from $8.54 million last week, indicating a 23% decline in the notional value of active positions. Typically, the decline in OI and spot price indicates a firm sell-side bias with a risk-off sentiment amid forced liquidation.
Technical outlook: How low will PI go?
Pi Network trades at $0.0656 at press time on Monday, extending its bearish tone to a record low. The price remains capped below an overhead resistance trendline at $0.0757 and breaks below the previous swing low of $0.0704 set on July 14.
PI sits well below the 50-day Exponential Moving Average (EMA) at $0.0803 and the 200-day EMA at $0.1101, keeping the broader trend decisively under pressure. Momentum shows oversold conditions, with the Relative Strength Index (RSI) reading near 18, suggesting a stretched downside. Meanwhile, the Moving Average Convergence Divergence (MACD) line crosses below its signal line in the negative territory, reinforcing weak momentum.
Looking down, the Fibonacci retracement of the previous downswing from $0.1394 to $0.0704 highlights the next support at the 127.2% extension level at $0.0516, followed by the 161.8% extension level at $0.0277.
On the topside, initial resistance is now evident at the broken horizontal support at $0.0704, followed by the trendline break level around $0.0757, which previously acted as a pivotal barrier.
(The technical analysis of this story was written with the help of an AI tool. Know more.)
Author

Vishal Dixit
FXStreet
Vishal Dixit holds a B.Sc. in Chemistry from Wilson College but found his true calling in the world of crypto.