Solana Price Forecast: Persistent ETF outflows extend downside risk in SOL
- Solana hovers below $90 on Monday after its fifth consecutive weekly decline, down 8% last week, which broke a crucial support level.
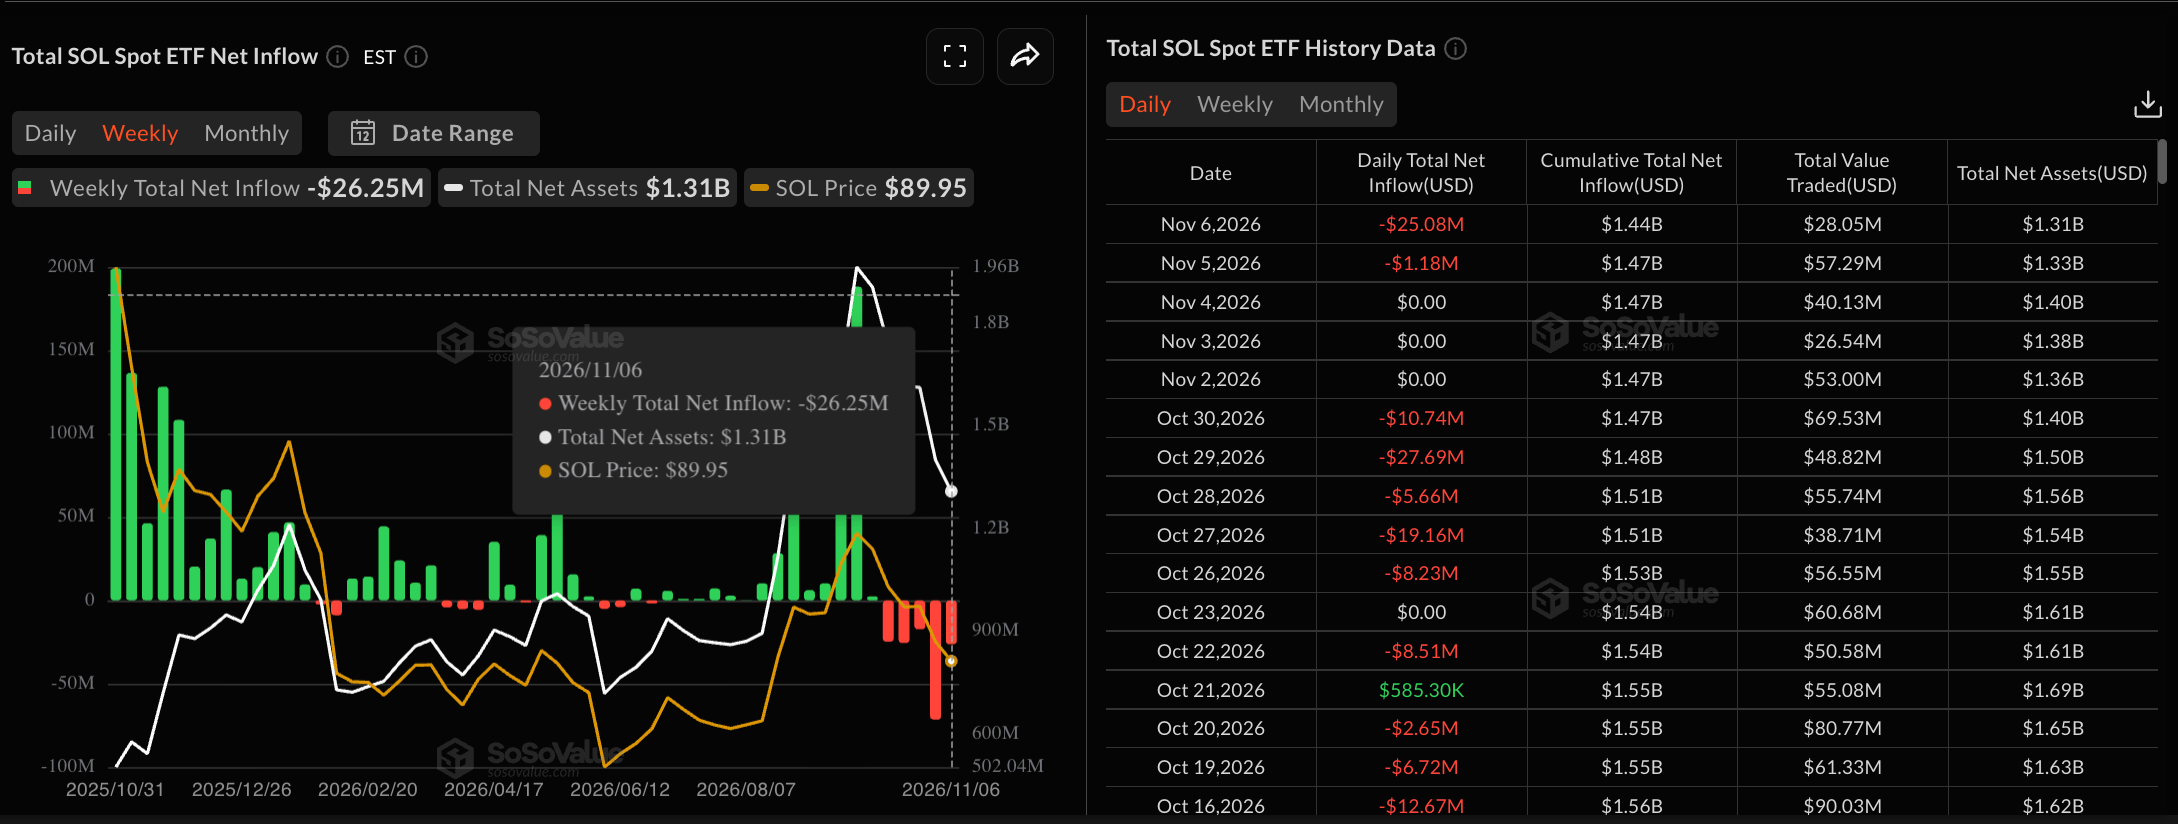
- SOL-focused ETFs recorded over $26 million in outflows last week, witnessing the fifth straight week of selling pressure.
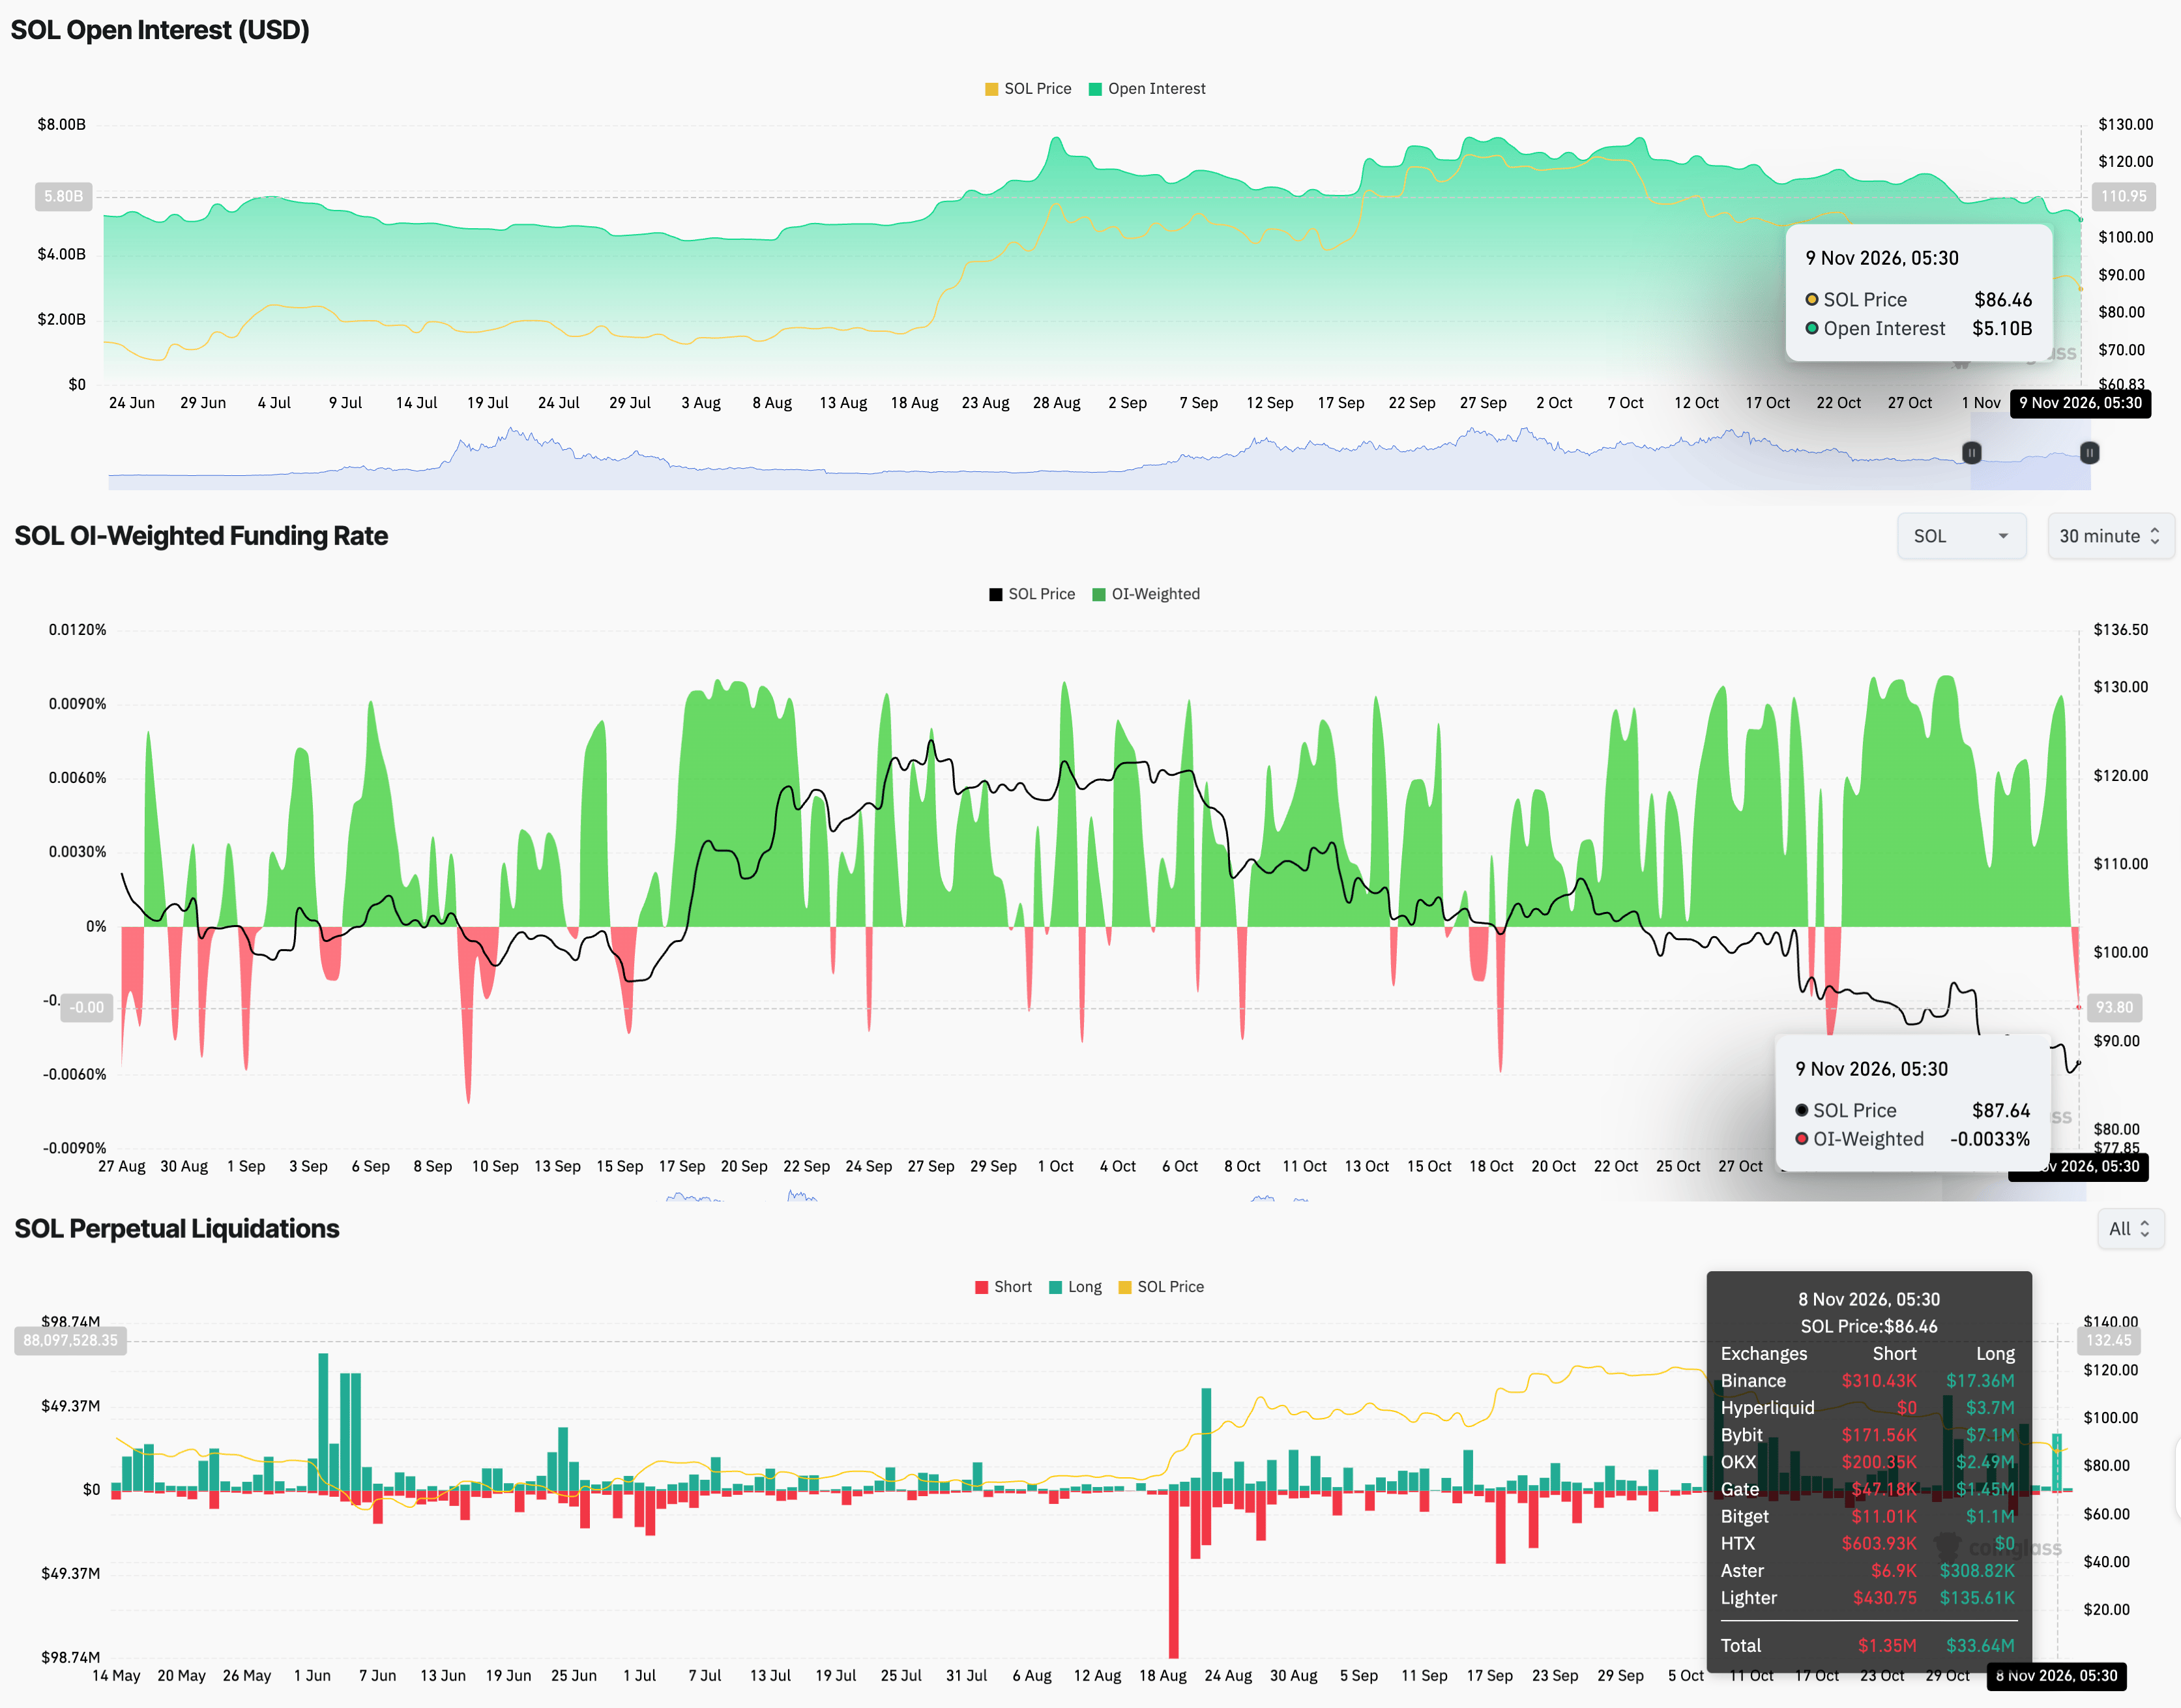
- Declining SOL futures Open Interest and funding rates suggest waning retail appeal.

Solana (SOL) trades below $90 on Monday, ticking higher after over 3% losses below a long-term support trendline the previous day. SOL has been steadily declining over the last five weeks, aligning with five straight weekly outflows from Solana-focused Exchange-Traded Funds (ETFs) totaling over $150 million. Solana is also losing retail strength, as steady positional unwinding has dropped Open Interest to a two-month low, while a negative funding rate reaffirms a persistent sell-side bias.
Technically, Solana faces a downside risk to $77 as selling pressure persists.
ETF outflows, declining Open Interest weigh on SOL
Multiple bearish signals suggest further downside risk in Solana, including ETF outflows and declining Open Interest (OI). According to SoSoValue, Solana ETFs have recorded nearly $170 million in outflows over the last five weeks, including the $26.25 million last week and the largest weekly outflow of $71.47 million the previous month. Such heavy redemptions reflect a declining demand for Solana among institutional investors amid broader market uncertainty.
On the other hand, CoinGlass data shows SOL futures OI down to $5.10 billion on Monday, the lowest since August 19, after a steady unwinding from the October 8 high of $7.62 billion. The positional wipeout aligns with the spot price decline and ETF outflows, implying that ETF outflows are the key catalyst of the ongoing correction spree. For traders waiting for a rebound in SOL, a weekly ETF inflow could hint at a potential trend reversal.
However, the funding rate of -0.0033% suggests a near-term selling bias among traders, willing to pay a premium to buy short positions. In addition, long liquidations of $33.64 million on Sunday outpaced short liquidations of $1.35 million, reaffirming stronger selling pressure.
Technical outlook: Will SOL defend the $80 mark?
Solana trades at $87.60 at press time on Monday, maintaining a steady decline since early October. SOL dropped 8% last week, extending the 19% decline in October, and fell below the 200-day Exponential Moving Average (EMA) at $99.26 and a long-term ascending trendline connecting the June 6 and August 1 lows, around $90.41. In addition, the declining 50-day EMA at $100.35 risks crossing below the 200-day EMA, a pattern commonly referred to as a death cross, which would confirm a bearish trend reversal.
Momentum remains weak on the daily chart, with the Relative Strength Index (RSI) hovering near oversold territory at 29 and the Moving Average Convergence Divergence (MACD) still negative, hinting that downside pressure is not yet exhausted despite the stretched conditions.
On the downside, immediate support sits just below the market at $87.46 horizontal level, ahead of a more meaningful demand zone around $77.60. A sustained break there would expose deeper supports at $67.50 and $60.13, where the broader uptrend base from prior months converges.
On the topside, initial resistance is seen at the former trendline break near $90.41, followed by a horizontal cap at $95.82.
(The technical analysis of this story was written with the help of an AI tool. Know more.)
Author

Vishal Dixit
FXStreet
Vishal Dixit holds a B.Sc. in Chemistry from Wilson College but found his true calling in the world of crypto.