Band Protocol price looks poised to recover as BAND technicals turn bullish
- Band Protocol price sits underneath a massive supply wall while technicals turn bullish.
- Moving past the $4.26-$4.51 resistance could see BAND rise to $6.

Band Protocol’s native cryptocurrency, BAND, has endured a three-month-long corrective period that has seen its price drop by nearly 78%. The cross-chain data oracles token went from trading an all-time high of $18.2 in mid-August to hit a low of $4 recently.
Despite the massive losses incurred, a particular technical indicator suggests that this cryptocurrency is poised for a trend reversal.
Band Protocol price prepares to rebound
The TD Sequential indicator recently presented buy signals on BAND’s 1-week and 1-day chart. The bullish formations developed in the form of red nine candlesticks. A spike in demand for the DeFi altcoin may help validate the optimistic outlook.
If buy orders begin to pile up, the TD setup forecasts that BAND price could experience a one to four candlesticks upswing or start a new upward countdown. Considering that the TD’s bullish signals were created on the weekly and daily charts, validation may lead to a full-blown price recovery.
-637399220146809225.png)
BAND/USD 1-week and 1-day charts
When looking at BAND’s holder distribution, the bullish thesis holds. Data from the behavioral analytics platform Santiment shows large investors have been adding a significant number of tokens to their portfolios.
Since mid-October, the number of addresses holding 10,000 to 1 million BAND has done nothing but shot up. Roughly nine new whales have joined the network, representing a 22.5% increase in such a short period.
 [14.21.28, 02 Nov, 2020]-637399220710000153.png)
The recent spike in the number of BAND whales may seem insignificant at first glance. However, when considering that these addresses hold up to $4.3 million in BAND, the sudden increase in buying pressure can translate into millions of dollars.
If the buying spree continues, Band Protocol price might have the ability to recover and validate the TD Sequential’s outlook.
Massive supply wall ahead
It is worth noting that there is a massive supply wall ahead of the decentralized oracles token. IntoTheBlock’s “In/Out of the Money Around Price” (IOMAP) model reveals that more than 450 addresses had previously purchased 530,000 BAND between $4.26 and $4.51.
Such a significant area of interest may absorb some of the buying pressure. But breaking through it could lead to an upswing towards $6 where 9,000 addresses hold over 2 million tokens.
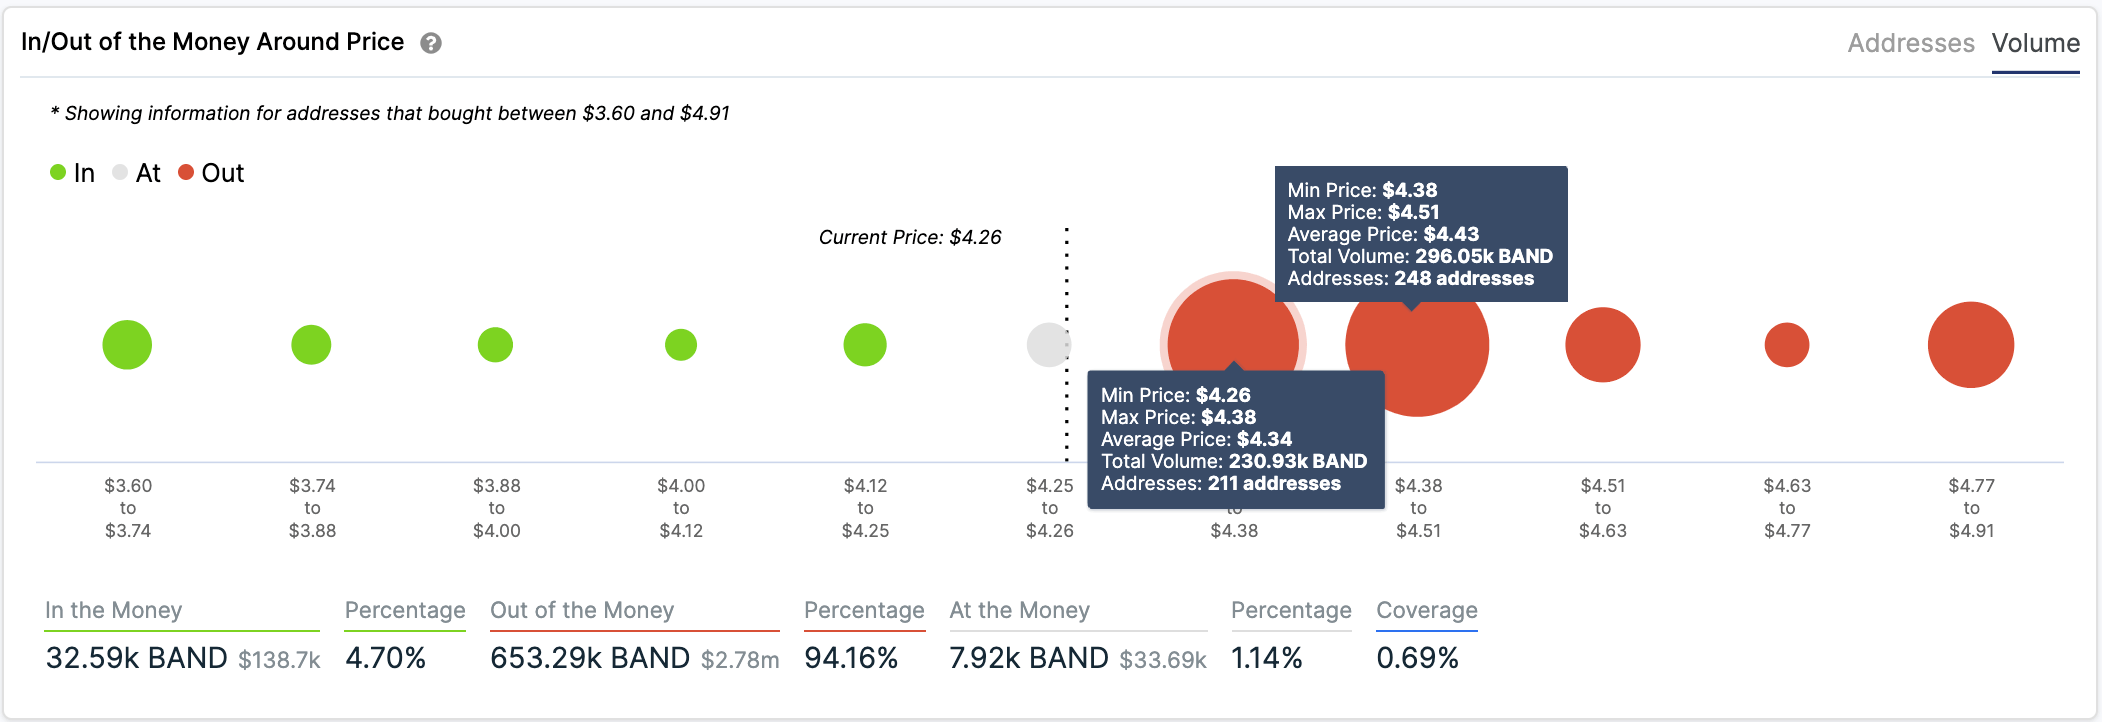
On the flip side, Band Protocol price must hold above $4 to avoid invalidating the bullish outlook. Failing to do so will increase the odds for another sell-off that pushes prices to the next critical area of support, around $2.
Author

FXStreet Team
FXStreet
Composed of a group of economic journalists and FX experts, the FXStreet content team produces and oversees all content published on FXStreet. It provides a purely journalistic approach to the Forex market.



