Band Protocol Price Analysis: BAND/USD is ripe for correction
- Band Protocol has enjoyed a steady growth of network activity.
- The token may be ready for a short-term price correction.

Band Protocol (BAND) takes the 55th place in the global cryptocurrency rating compiled by CoinMarketCap. The coin with the current market capitalization of $320 million has gained nearly 10% in the recent 24 hours; the price topped at $16.82 and retreated to $15.6 by press time. Notably, the trading volumes have stayed elevated even though BAND came down from the intraday high.
Market activity speaks volumes
BAND started the ascend at the beginning of July 2020 and since that time the price of the token grew by over 1500%. The stellar results attracted new investors and new capital flows, which ended in increased market activity. According to the stats, provided by Intotheblock, the number of active addresses hit a new all-time high in September.
Along with the recent price surge, the number of active addresses in a day reached a new all-time high. On September 1, 1.6 thousand addresses were active, surpassing the previous record established on August 10 of 1.58 thousand addresses.
This is indicative of positive network development and may imply that the upside momentum may gain traction in the long run. However, the short-term technical picture is less optimistic.
BAND/USD: The technical picture
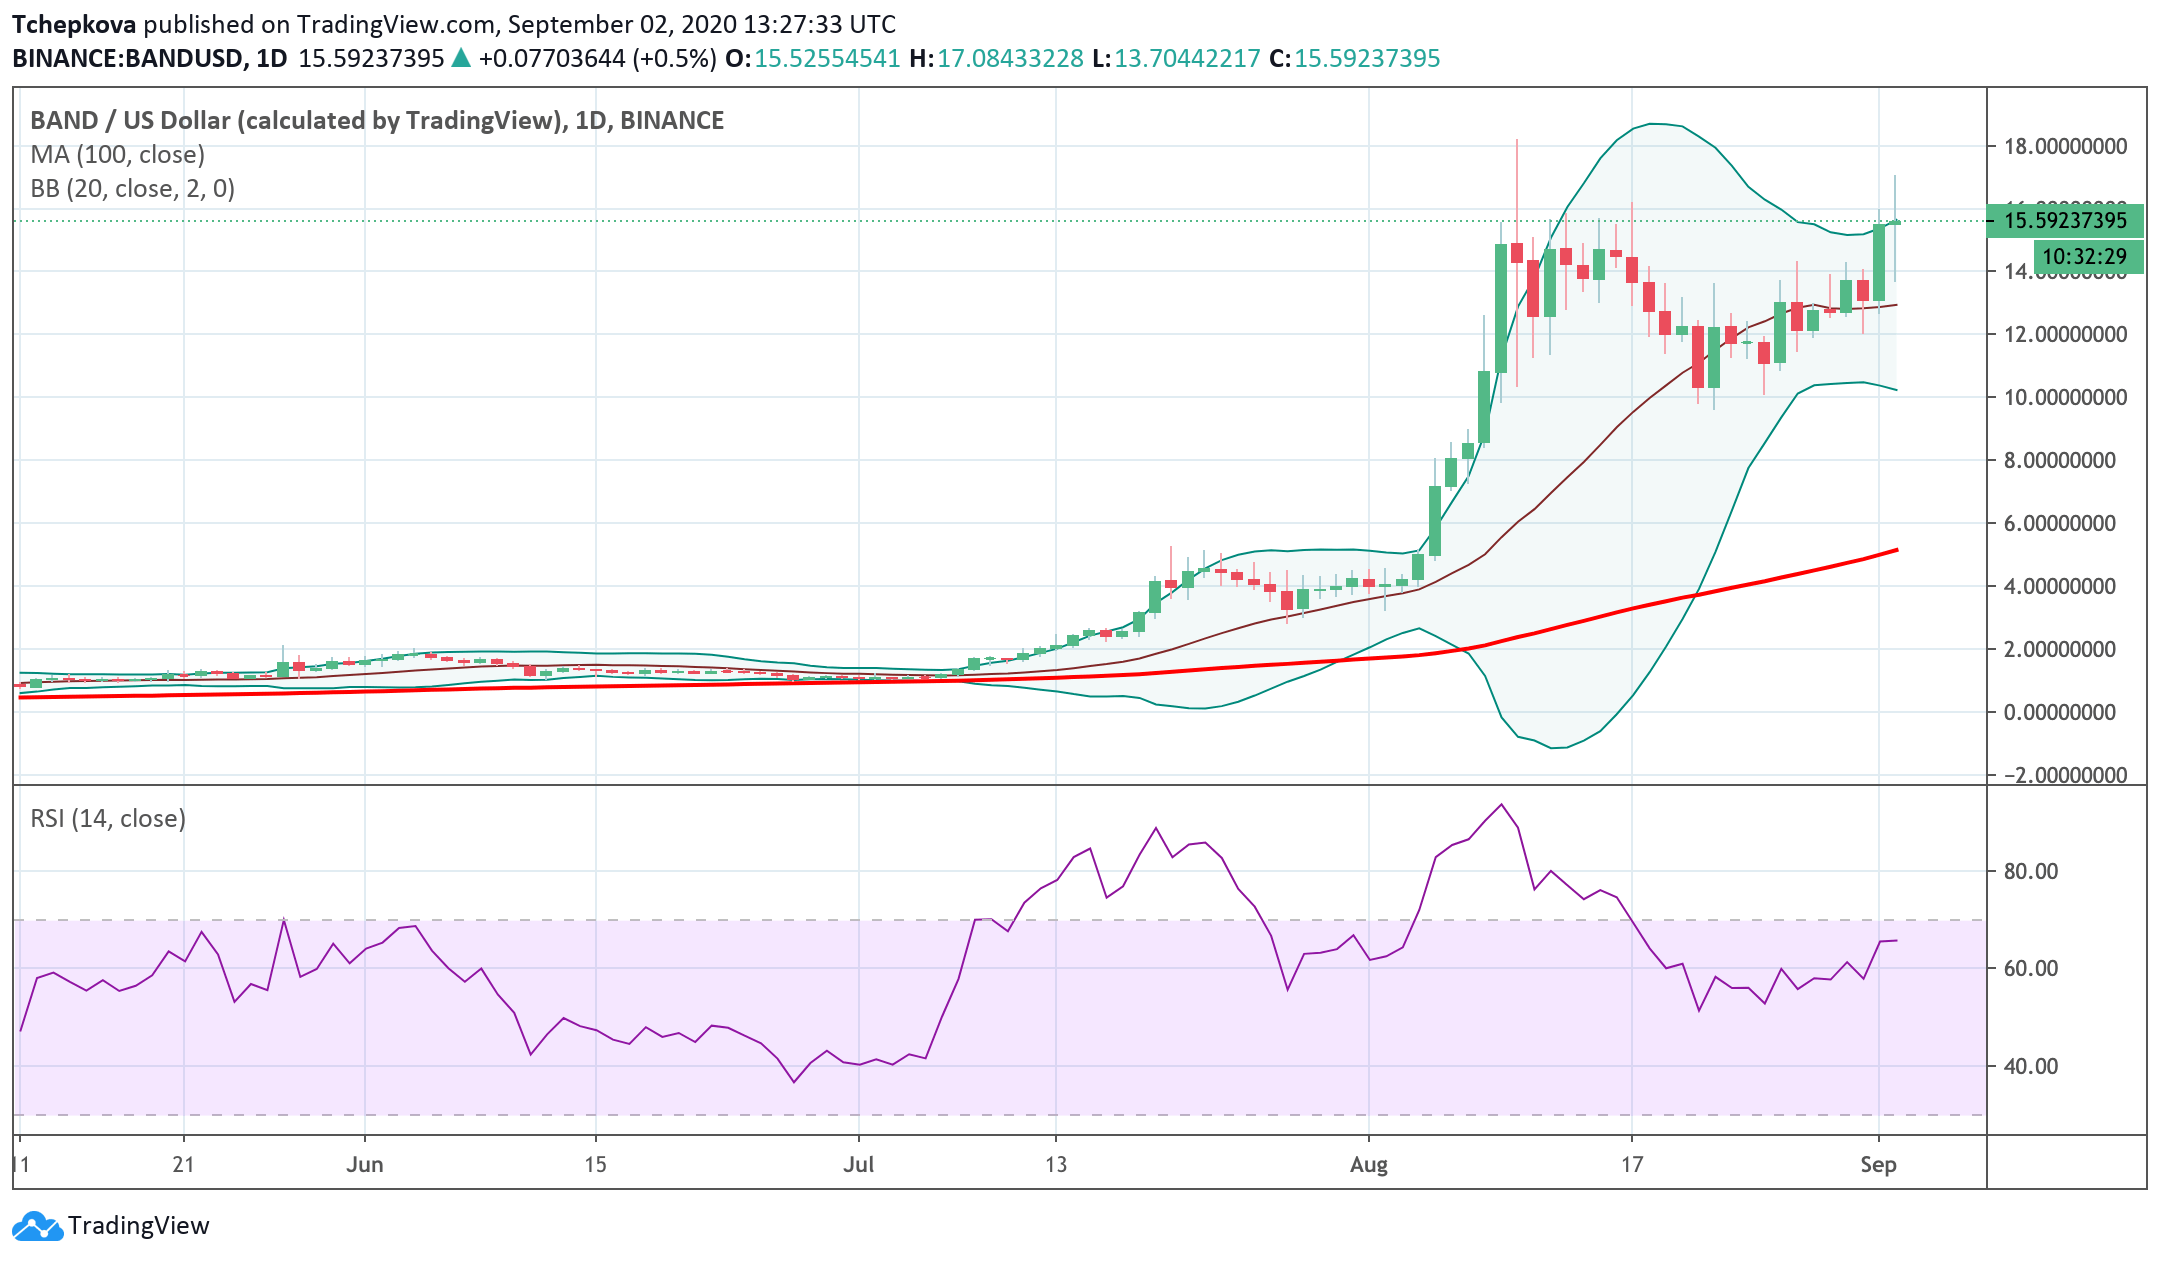
On a daily chart, BAND/USD returned inside the Bollinger Band and created a long-legged Doji candle after a sharp bullish move. The market is uncertain about the next move, while the jitters make the price vulnerable to further downside correction with the first aim at $13 ( the middle line of the daily Bollinger Band). Once it is out of the way, the sell-off is likely to gain traction with the next focus on the psychological $10 reinforced by August 22 low and the lower line of the daily Bollinger Band.
However, if the price settles above $15 and turns it into a support, the upside momentum will gain traction with the next focus on $16.00 and the recent high of $16.82. A sustainable move above this area will open up the way towards the all-time high of $18.22.
BAND/USD daily chart

Author

Tanya Abrosimova
Independent Analyst


