AVAX to pull back and find support before Avalanche smashes through $100
- AVAX price pushed new all-time highs, halted just short of the critical $100 level.
- Ichimoku analysis and oscillators show AVAX is a little extended.
- A pullback to equilibrium is expected to occur soon.

AVAX price has made substantial gains over the past two weeks. It took traders forty-five days of consolidation to eventually push AVAX above its prior all-time high of $74 to the new all-time high at $97. Just short of $100 is where sellers came in. A pullback is very likely before AVAX can burst through the $100 value area.
AVAX price stop just $3 shy of $100, overbought and extended price action the likely culprit
AVAX price has several technical reasons why it is finding some difficulty hitting the $100 level. The primary reason is the large gap between the body of the candlesticks and the Tenkan-Sen. One of the behaviors of the Ichimoku Kinko Hyo system is the close relationship between the candlesticks and the Tenkan-Sen – they like to move together, almost like holding hands. When gaps develop between the two, things become volatile, and traders often see fast corrective moves that return to the Tenkan-Sen. AVAX price is in one of those conditions right now.
Adding to the likely hood of the pullback are the Optex Bands trading in the extreme overbought levels and the Composite Index trading near a historical resistance range. The combination of the gap between the candlesticks and the Tenkan-Sen with the overbought and extended conditions in the oscillators points to AVAX dipping lower. Support will likely be found between the Kijun-Sen ($75) and the Tenkan-Sen ($80). If there is a much deeper corrective move, then the most potent level of near-term support range is between the 50% Fibonacci retracement at $54 and Senkou Span B at $56.
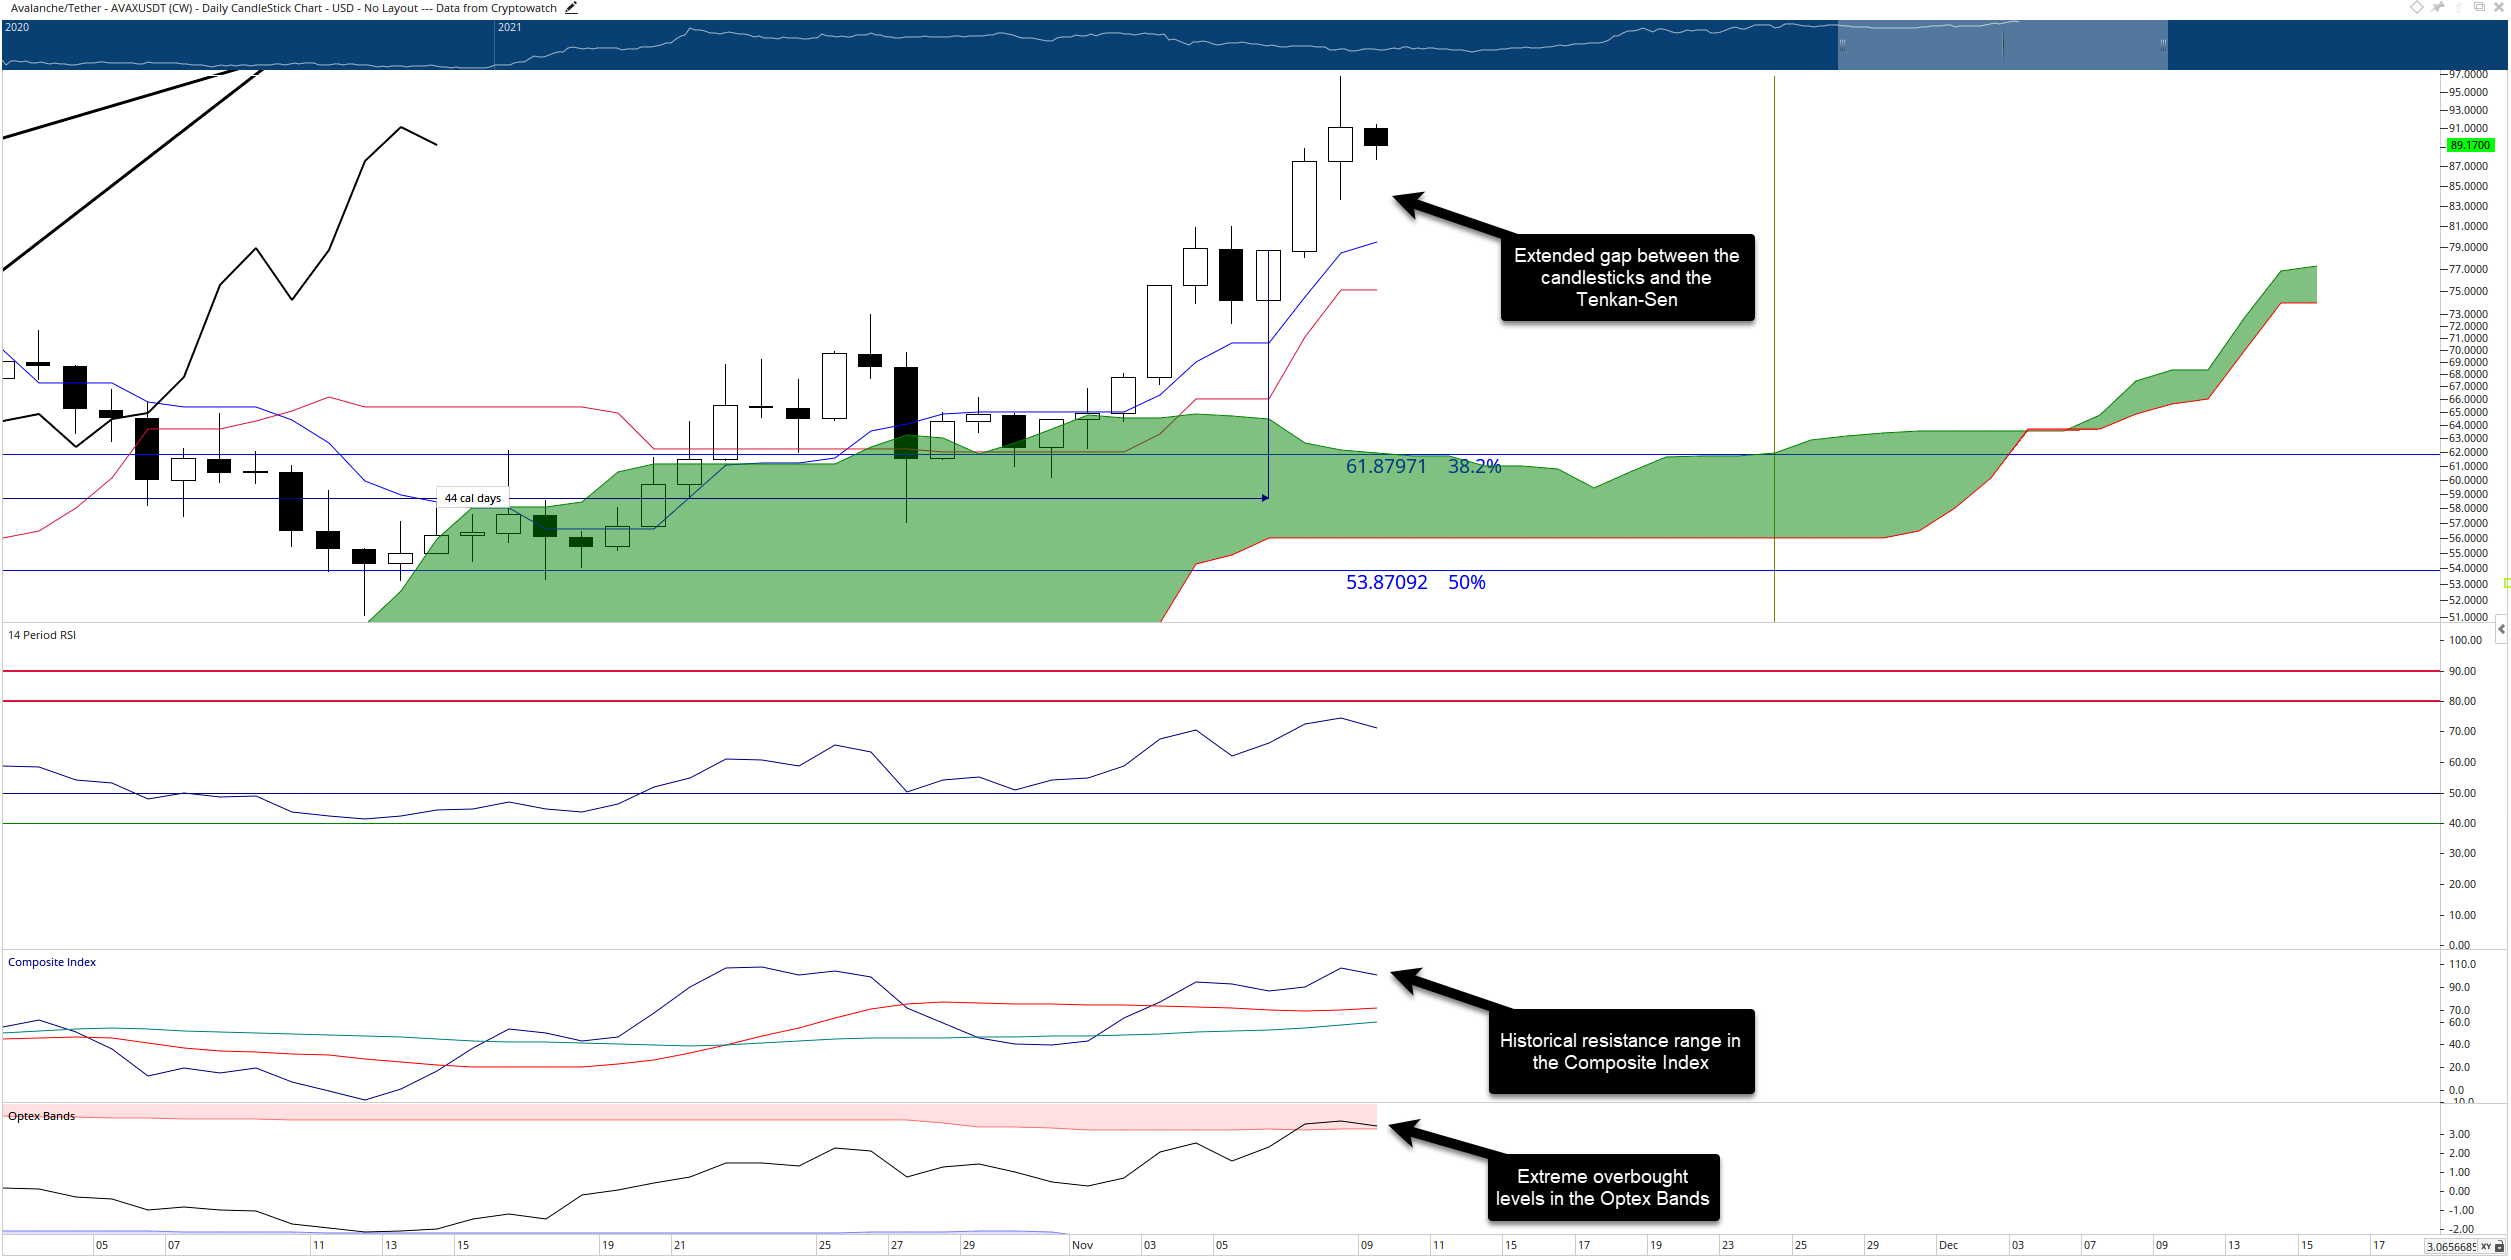
AVAX/USDT Daily Ichimoku Chart
However, cryptocurrencies are likely in a strong altcoin bull market, and the extended conditions may become more extended. Consolidation between $90 and $98 without a pullback is also possible. Any new daily close at or above $100 would invalidate any projections of an imminent pullback.
Author

Jonathan Morgan
Independent Analyst
Jonathan has been working as an Independent future, forex, and cryptocurrency trader and analyst for 8 years. He also has been writing for the past 5 years.


