Assessing the direction of Dogecoin price trend to identify trading opportunities
- Dogecoin price is describing a triangle on a four-hour chart, suggesting an 18% breakout.
- A decisive move above $0.087 will confirm a move that will likely propel DOGE to $0.10.
- If sellers produce a four-hour candlestick close below $0.076, it will indicate a bearish breakout and result in a crash to $0.062.

Dogecoin price is unfolding with a triangle’s declining trend line and horizontal support. This coiling up is likely to result in a volatile breakout that will either propel DOGE or result in a steep correction. So, investors need to be patient and wait for a confirmation of the directional bias before leaning to either side.
Dogecoin price hints at an explosive move
Dogecoin price set up four lower highs and three equal lows since May 12. Connecting these swing points describes a descending triangle, which though normally considered bearish, in this case, is likely to lead to a bullish breakout and an 18% move higher. This target is obtained by adding the distance between the first swing high and the swing low to the breakout point.
The bullish forecast is based on the assumption that Dogecoin price will follow Bitcoin, which is likely to undergo a relief rally. For confirmation, investors should wait for a decisive four-hour candlestick close above $0.087, signaling buyers are back.
A flip of the aforementioned level will lead to Dogecoin price retesting the $0.10 hurdle. This move would constitute an 18% gain from the breakout point at $0.084 and 15% if measured from the $0.087 barrier.
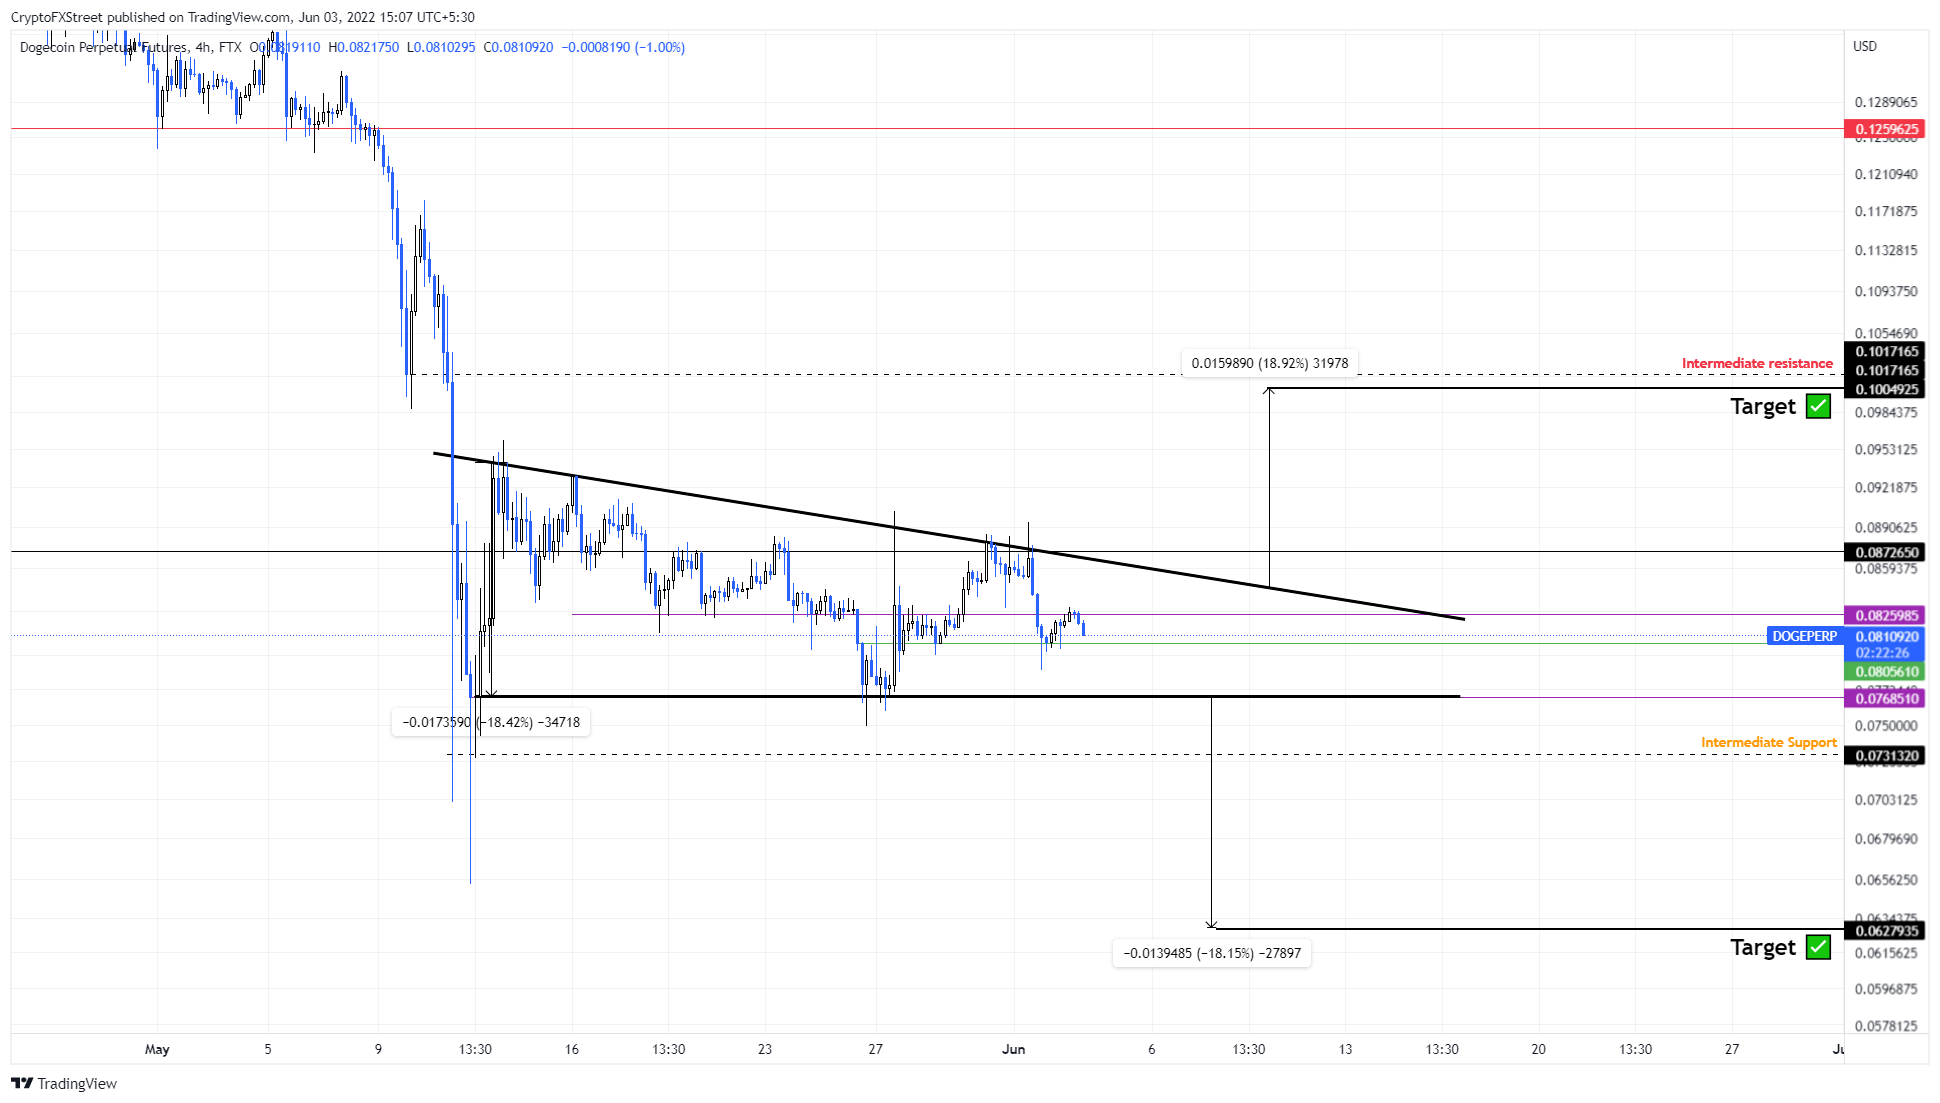
DOGE/USDT 4-hour chart
While things are looking bullish for Dogecoin price, investors need to understand that this optimism is derived from Bitcoin and its potential move. Therefore, a sudden sell-off in Bitcoin price that pushes Dogecoin price to produce a four-hour candlestick close below $0.076 will reveal a bearish breakout and invalidate the bullish thesis.
This development will further crash DOGE by 18% to retest the $0.062 support floor.
Author

Akash Girimath
FXStreet
Akash Girimath is a Mechanical Engineer interested in the chaos of the financial markets. Trying to make sense of this convoluted yet fascinating space, he switched his engineering job to become a crypto reporter and analyst.



