Arbitrum price edges closer to 50% rally
- Arbitrum price shows a clear struggle around the $1.12 weekly hurdle.
- A successful flip of this level into a support floor could trigger $1.28, $1.14 and $1.68 levels.
- A daily candlestick close below the $0.94 barrier will invalidate the bullish thesis for ARB.

Arbitrum (ARB) price continues to struggle around the $1 psychological level as capital flows to popular Layer 1 tokens. As the narrative around Layer 1 tokens exhaust, the capital is likely going to rotate to Layer 2 tokens like Arbitrum, Polygon, Optimism and so on.
Read more: Altcoin bull cycle 2023 picks by analyst: Ethereum, ChainLink, Arbitrum, Optimism
Arbitrum price hesitates, but eyes a rally
Arbitrum price currently trades around $1.10 and has been trading around this level since early November. A successful flip of the $1.12 weekly hurdle has increased the probability of a bullish move, but ARB still needs to overcome the $1.28 barrier.
If both these barriers are flipped into support levels, Arbitrum price could easily target the $1.40 level, roughly 23% away from the current price. However, ARB is unlikely to stop here after a flip of the weekly barriers, so the altcoin could target the next key level at $1.68.
This move in Arbitrum price would constitute a 50% gain from the $1.12 weekly level and is likely the short-term target for ARB holders.
Read more: Arbitrum Price Forecast: ARB ponders 50% breakout
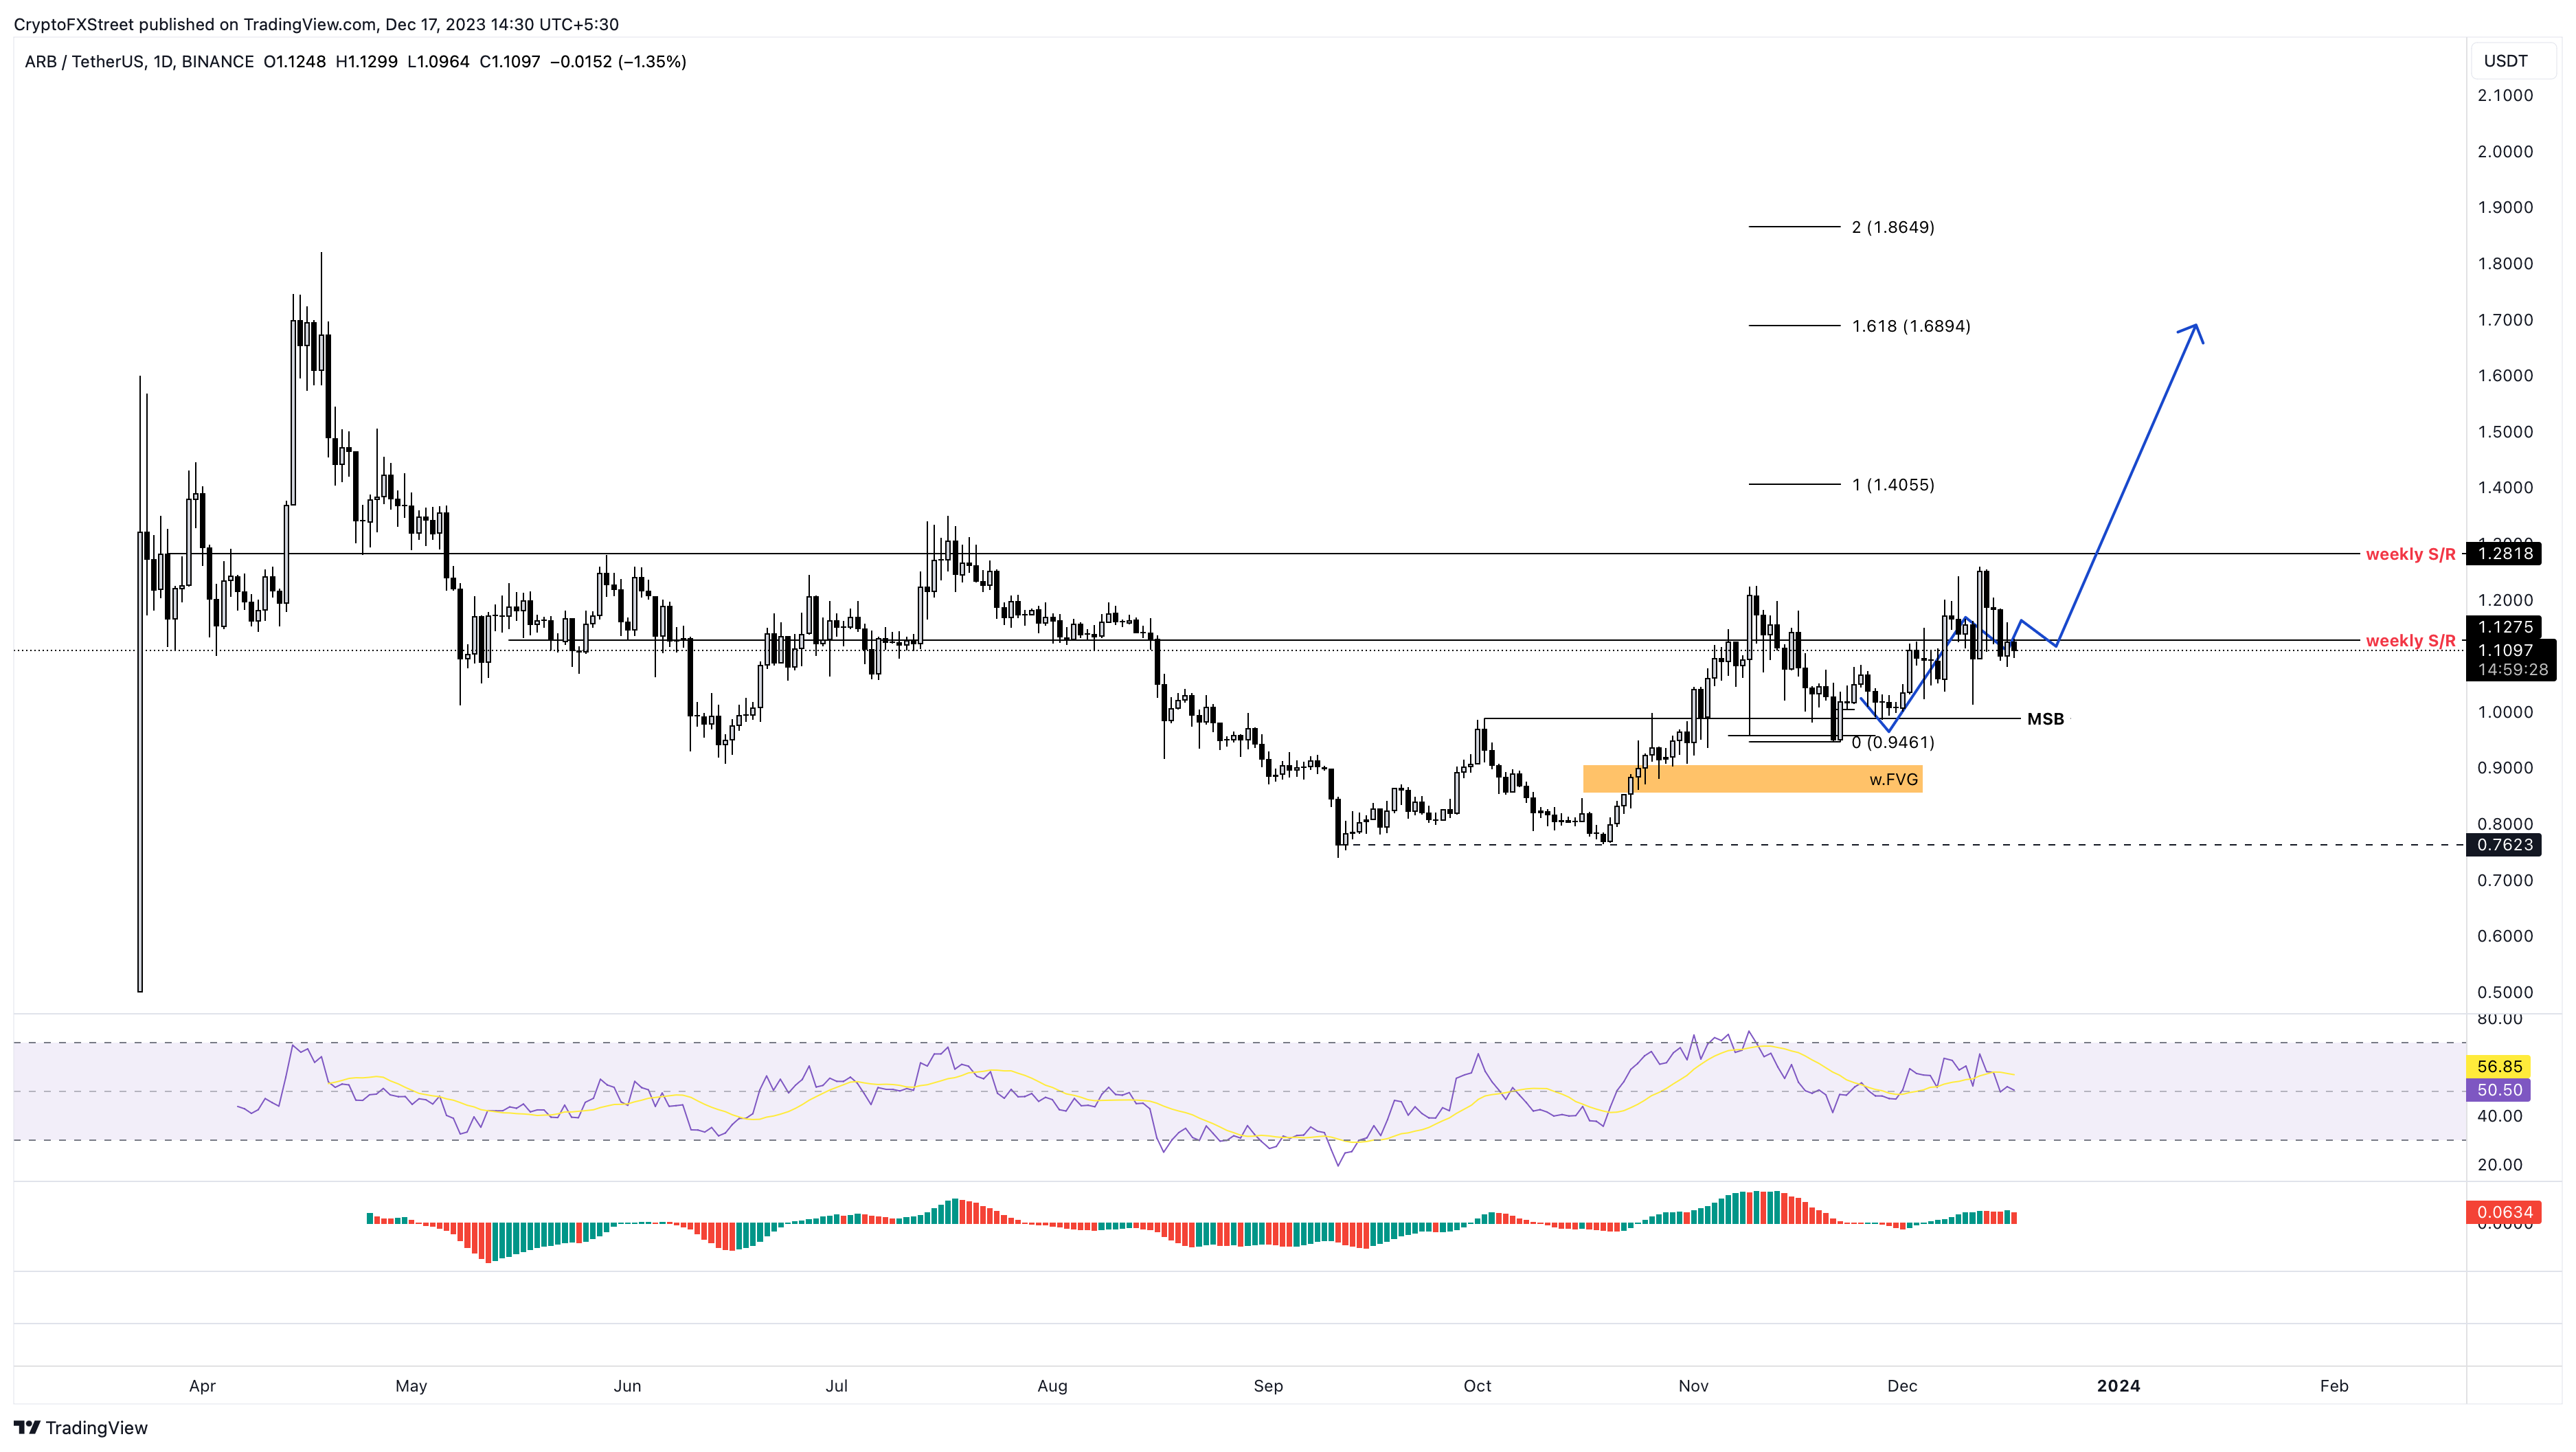
ARB/USDT 1-day chart
According to IntoTheBlock’s Global In/Out of the Money (GIOM) model, the $1.13 level is the main hurdle preventing Arbitrum price from moving higher. Roughly 175,0000 addresses that purchased 2.46 billion ARB tokens between the $1.07 and $1.17 range are sitting at breakeven here. If ARB manages to overcome $1.13, it would push most investors into profit and reduce the overhead selling pressure.
The GIOM also shows that the next key hurdle ranges from $1.33 to $1.70, where 2.52 billion ARB purchased by 188,320 addresses at an average price of $1.39 are out of the money. The $1.70 level coincides closely with the 50% target seen from a technical perspective.

ARB GIOM
While the outlook for Arbitrum price is reasonable, investors need to be wary of the weekly level of $1.12. This barrier was significant trouble to ARB in early November, creating a fake breakout.
If something similar were to happen, the chances of Arbitrum price slipping down to $0.94 level are high. If bears are successful at producing a daily candlestick close below the $0.94 barrier, it would create a lower low and invalidate the bullish thesis for ARB.
This development could see Arbitrum price slide 4% and tag the imbalance range, extending from $0.85 to $0.90.
Also Read: Arbitrum price veers as hard fork proposal receives 99.84% votes in favor
Author

Akash Girimath
FXStreet
Akash Girimath is a Mechanical Engineer interested in the chaos of the financial markets. Trying to make sense of this convoluted yet fascinating space, he switched his engineering job to become a crypto reporter and analyst.




