ApeCoin price shows no signs of slowing down, targets $25 next
- ApeCoin price created a new all-time high at $20.29 after producing a set of higher highs.
- Technicals suggest a bearish divergence could provide a buying opportunity before a move to $25.
- A daily candlestick close below $14.43 will invalidate the bullish thesis for APE.

ApeCoin price is taking a dangerous route that could lead to a steep correction if things do not simmer down. However, considering the massively bullish sentiment around APE, the upcoming retracement could also provide an opportunity for patient buyers to accumulate the altcoin at a discount before setting a new all-time high.
ApeCoin price prepares for a new high
ApeCoin price has set four higher highs and three higher lows since April 20 and created a new all-time high at $20.29. Connecting these swing points using trend lines reveals a falling wedge.
This technical pattern forecasts a 17% downswing, obtained by measuring the distance between the first swing high and low. While ApeCoin has not breached the falling wedge’s lower trend line, investors can speculate that it could occur on the next leg down at roughly $19.89. Therefore, adding the 17% measure to this level reveals a target of $16.47.
Adding credence to the downswing thesis is the bearish divergence between the price’s higher highs and the Relative Strength Index’s (RSI) lower highs. This technical formation suggests that the momentum is waning while the underlying asset’s value rises.
The resolution of this setup is a minor retracement, which falls in line with the falling wedge formation.
Investors can expect ApeCoin price to retrace by roughly 18% from its current position to $16.47. While this move is short-term bearish in outlook, for sidelined buyers this is an excellent opportunity to accumulate.
Based on the trend-based Fibonacci extension, the rally resulting from $16.47 will likely propel ApeCoin price to $24.57, a new all-time high. In total this run-up would constitute a 50% gain.
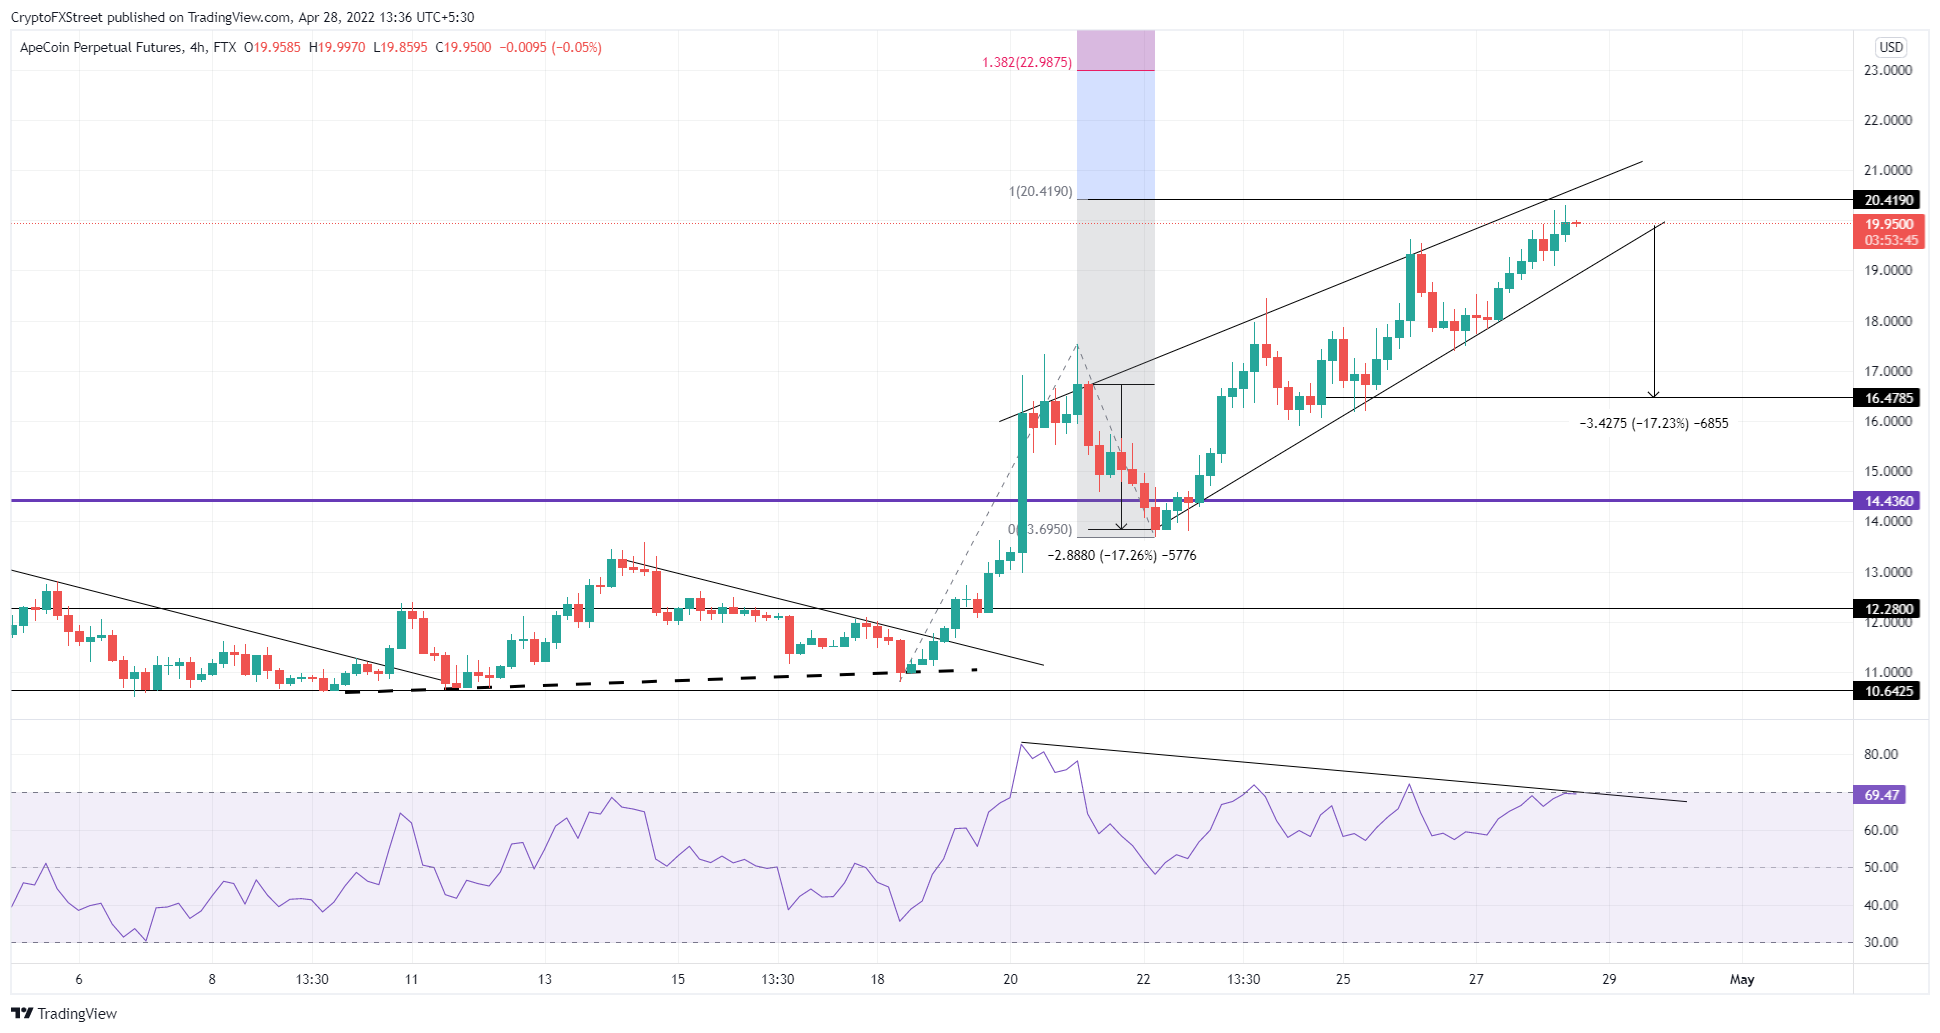
APE/USDT 4-hour chart
While things are looking up for ApeCoin price, a sudden surge in selling pressure that pushes it to produce a four-hour candlestick close below $16.47 will invalidate the bullish thesis. Such a development will open up the possibility of a further crash in APE’s market value to $14.43.
Author

Akash Girimath
FXStreet
Akash Girimath is a Mechanical Engineer interested in the chaos of the financial markets. Trying to make sense of this convoluted yet fascinating space, he switched his engineering job to become a crypto reporter and analyst.


