Analyzing the risks of selling pressure behind Bitcoin, Ethereum and Dogecoin

One of the foundational ethos of crypto is decentralization. It is a core component that enables one to not have to trust a centralized entity over the economical actions of the blockchain. It is common among investors to try to compare different blockchains by measuring how decentralized they are. But to compare them requires a reliable and realistis method that measures decentralization. Due to the pseudonymous nature of the blockchain and how linking entities to pseudonyms is a futile task, this becomes hard. When speaking about layer 1 blockchains, lots of ways are available to measure different characteristics of decentralization. Some focus on the centralization of block-producing capacity and thus determine how many compromised entities are needed to control the blockchain. This is measured with metrics such as Nakamoto coefficient or Gini coefficient.
But what about the current ownership of the coins of the network? The distribution of this ownership of the circulating supply is one of the most interesting for investors due to concentration risks that can lead to increased selling pressure and thus price depreciation.
To measure decentralization of ownership we use an indicator named Holdings Distribution Matrix which shows a breakdown of different groups of addresses according to the balance that they hold. These balances are translated to USD as well as represented as a percentage over the total of the circulating supply:
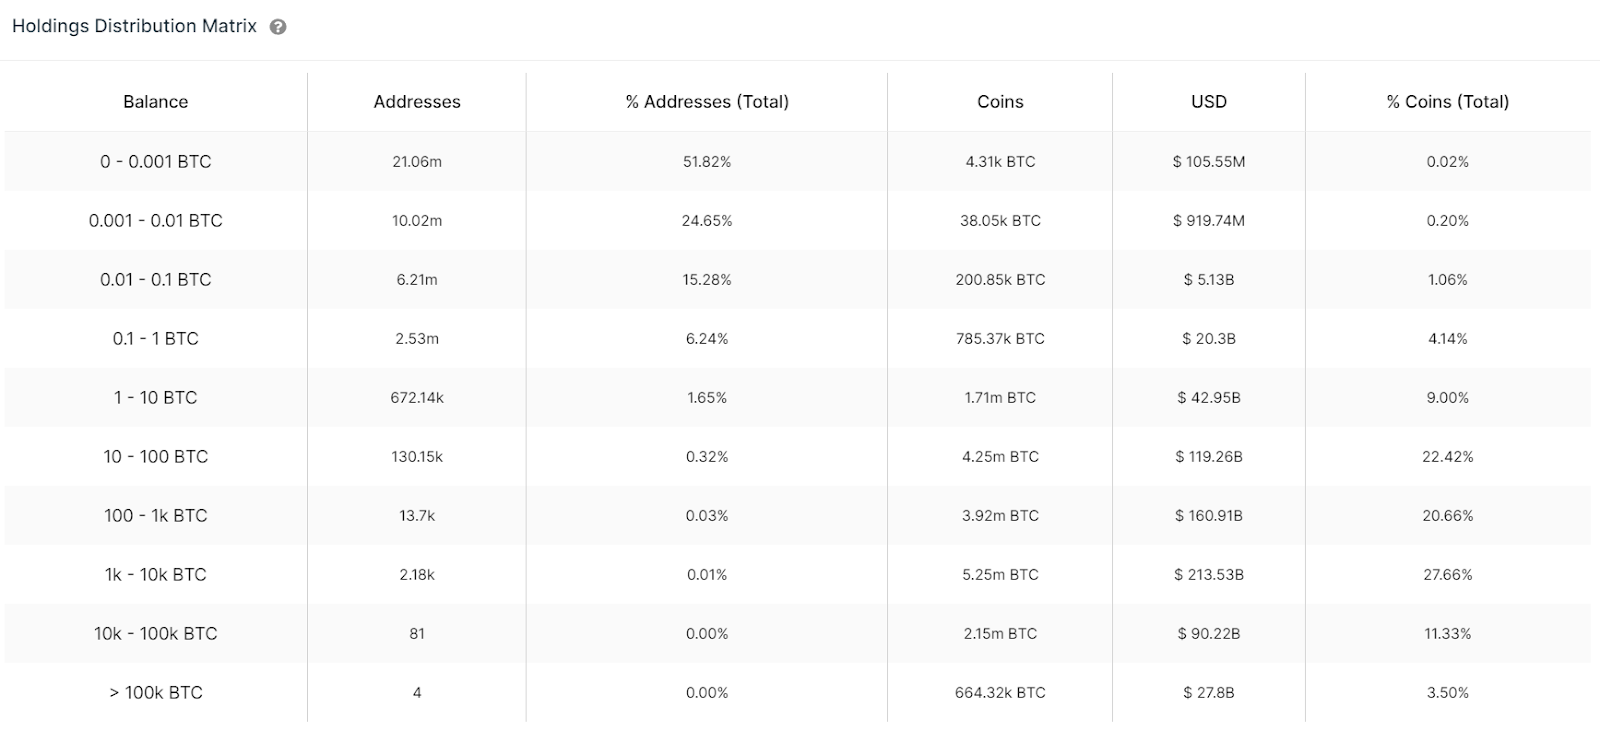
BTC Holdings Distribution Indicator via IntotheBlock
First starting with Bitcoin, it can be appreciated how more than half of the circulating supply is on users with less than 0.001 BTC ($44 at current prices). This reinforces the idea that most holders of BTC are not rich investors. The group of individuals with the largest purchasing power are those with balances between 1k to 10k BTC ($44M to $442M). There are more than 2,000 individuals who hold a combined purchasing power of more than $200B and control over 27% of the circulating supply. Currently, there are four single addresses that hold over 100k BTC, which means these could potentially be entities that hold more than $4.4Beach. Although 3 of them are known to be major exchanges’ cold wallets there is one that potentially could be related to Microstrategy.
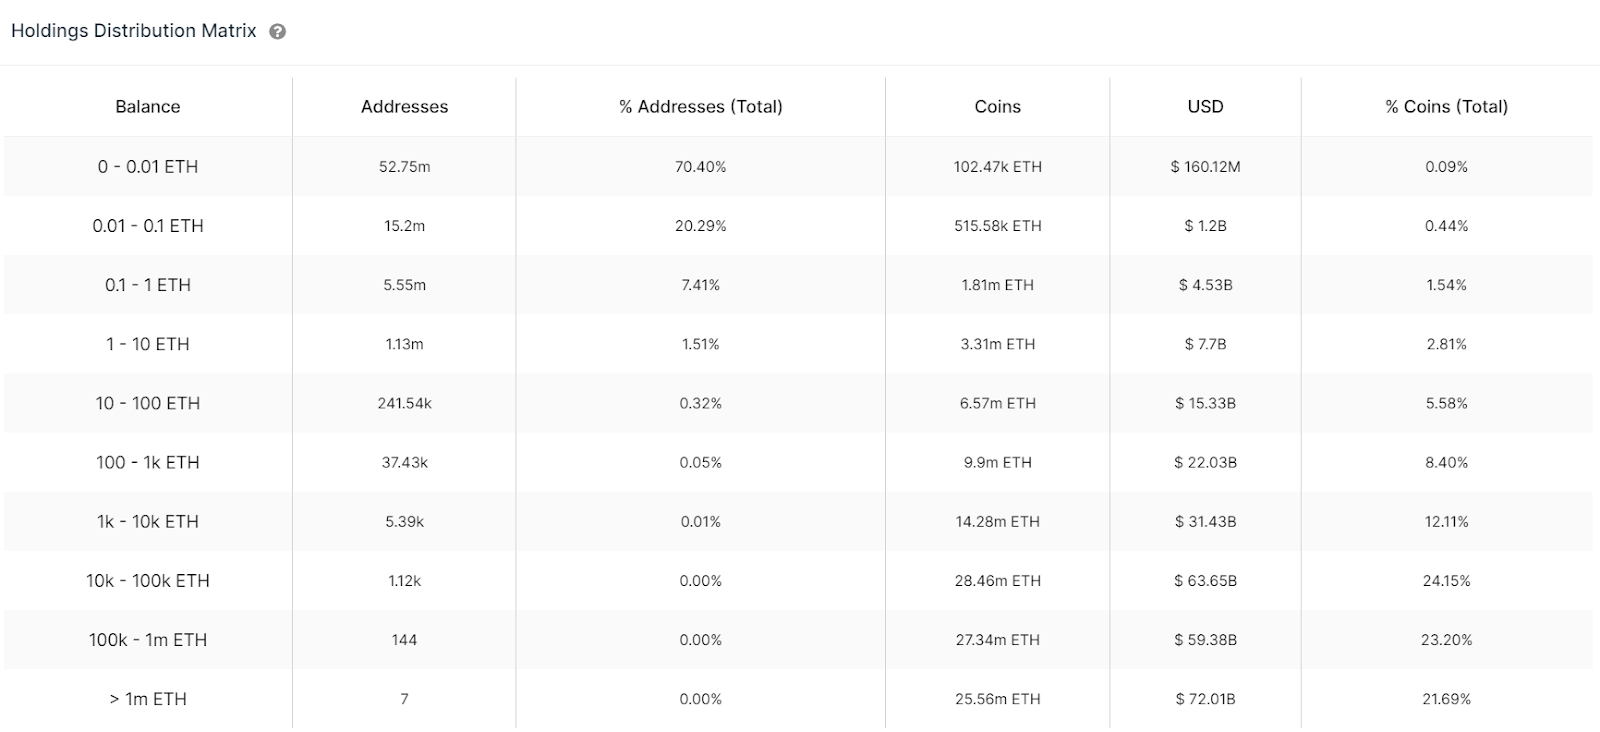
ETH Holdings Distribution Indicator via IntotheBlock
Regarding ETH, it is really surprising that over 70% of the total supply is held by investors with less than 0.01 ETH ($30). This is peculiar considering that ETH usage is not particularly cheap. The group with the largest purchasing power consists of seven addresses with over $70B of purchasing power. They hold 21% of the supply and according to the blockchain explorer three of them are smart contracts (Wrapped ETH for DeFi use, ETH2 staking address and Compound equivalent cETH) while the remaining addresses belong to two centralized exchanges and two unknown holders.
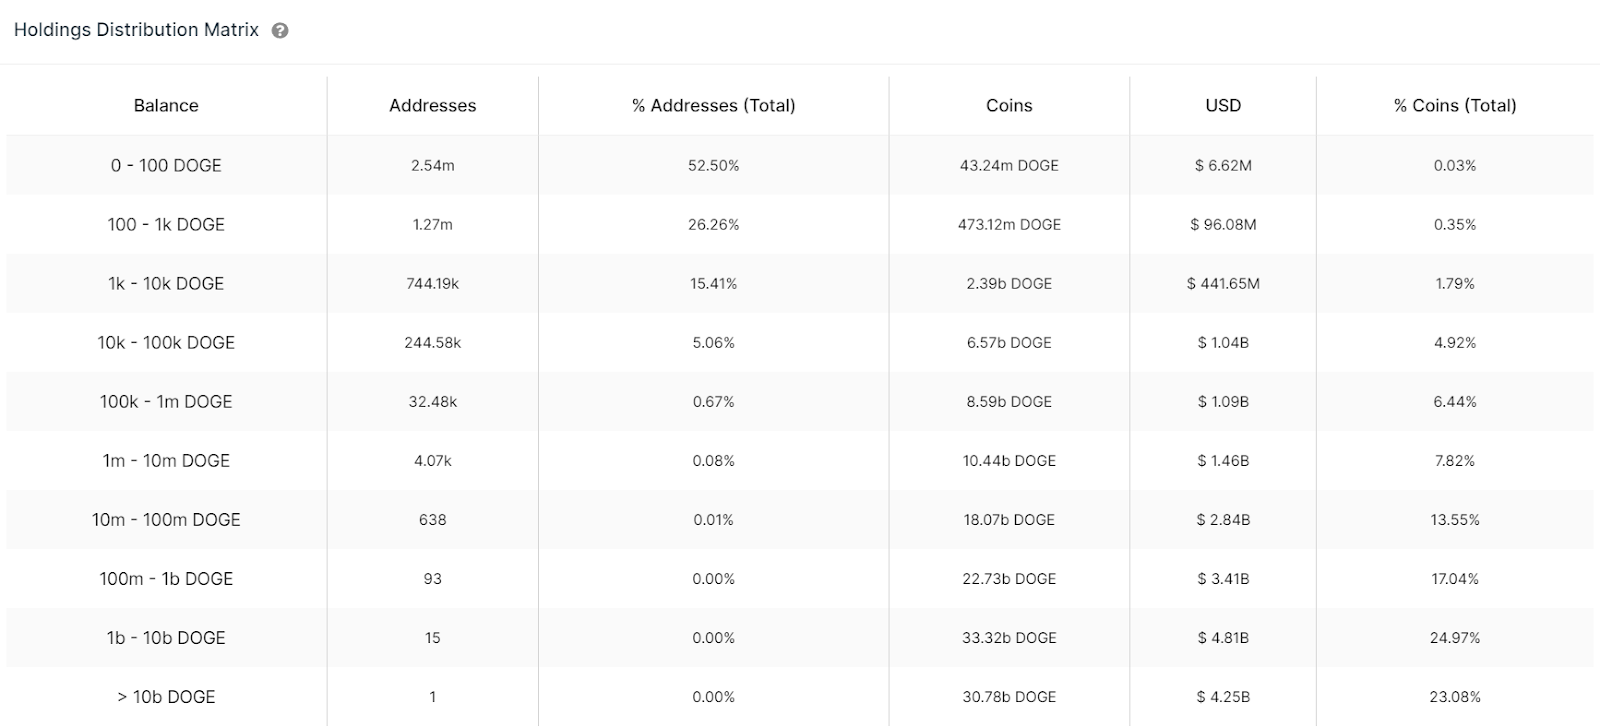
DOGE Holdings Distribution Indicator via IntotheBlock
The most notorious insight about the DOGE distribution is how a single address holds more than 23% of the supply. That is $4.25B at current prices. Some rumors think this single holder could be Elon Musk, or even more plausible a Robinhood wallet. Some even run the conspiracy further by stating that the activity of this wallet is related to other of the previously mentioned top wallets of ETH and BTC. Who knows? Besides that, the circulating supply of DOGE seems distributed very equally compared to the other blockchains.
Comparing how many addresses control over 90% of the supply an approximation summing up the number of addresses and supply we get: around 2.0% for BTC, 0.3% for ETH and 0.7% for DOGE. This argument has been a common critique about the centralized ownership of cryptocurrencies, despite that we have to consider three important caveats:
-
This is just an approximation that addresses are used as a proxy of single holders. This is imperfect due to the pseudonymous characteristic of the blockchains presented here, where a single entity could create several wallets and control them separately.
-
Although technically centralized exchanges are the real owners of most of these cryptocurrencies, practically that ownership is from their clients, so that can easily skew the metrics analyzed.
-
Smart contract platforms such as Ethereum tend to concentrate their supply in smart contracts that manage funds, commonly through DeFi applications. So practically funds are temporarily deposited there and their real ownership is more distributed.
In addition to the insights shown above, there is a correlation between how much time a blockchain has been going on and how concentrated it's coin ownership is. This relationship is related due to appreciation cycles where coin price increases bring new buyers at the same time that incentives big holders to offload some of its balance to fiat in order to take profits or rebalance their portfolios. In this way part of their coins are distributed towards those new holders. Although these price appreciations are related to adoption curves and crypto appreciation as a whole, it can be stated that over time the circulating supply of cryptocurrencies tends to decrease its concentration and thus increase its decentralization as long as their price appreciation is continued over time.
Author

IntoTheBlock Team
IntoTheBlock
IntoTheBlock Team consists of a tribe of data scientists, crypto experts and AI geeks.


