Altcoin Season: Ethereum outperforms Bitcoin as declining BTC dominance sirens Altseason ahead
- Ethereum strengthens against Bitcoin, signaling a shift in capital toward altcoins.
- The Bitcoin Dominance chart risks a downfall with a double top and bearish RSI divergence, signaling altcoins’ chance to shine.
- The Altseason Index indicates improved chances as the crypto market cap, excluding Bitcoin, surpasses $1.22 trillion.
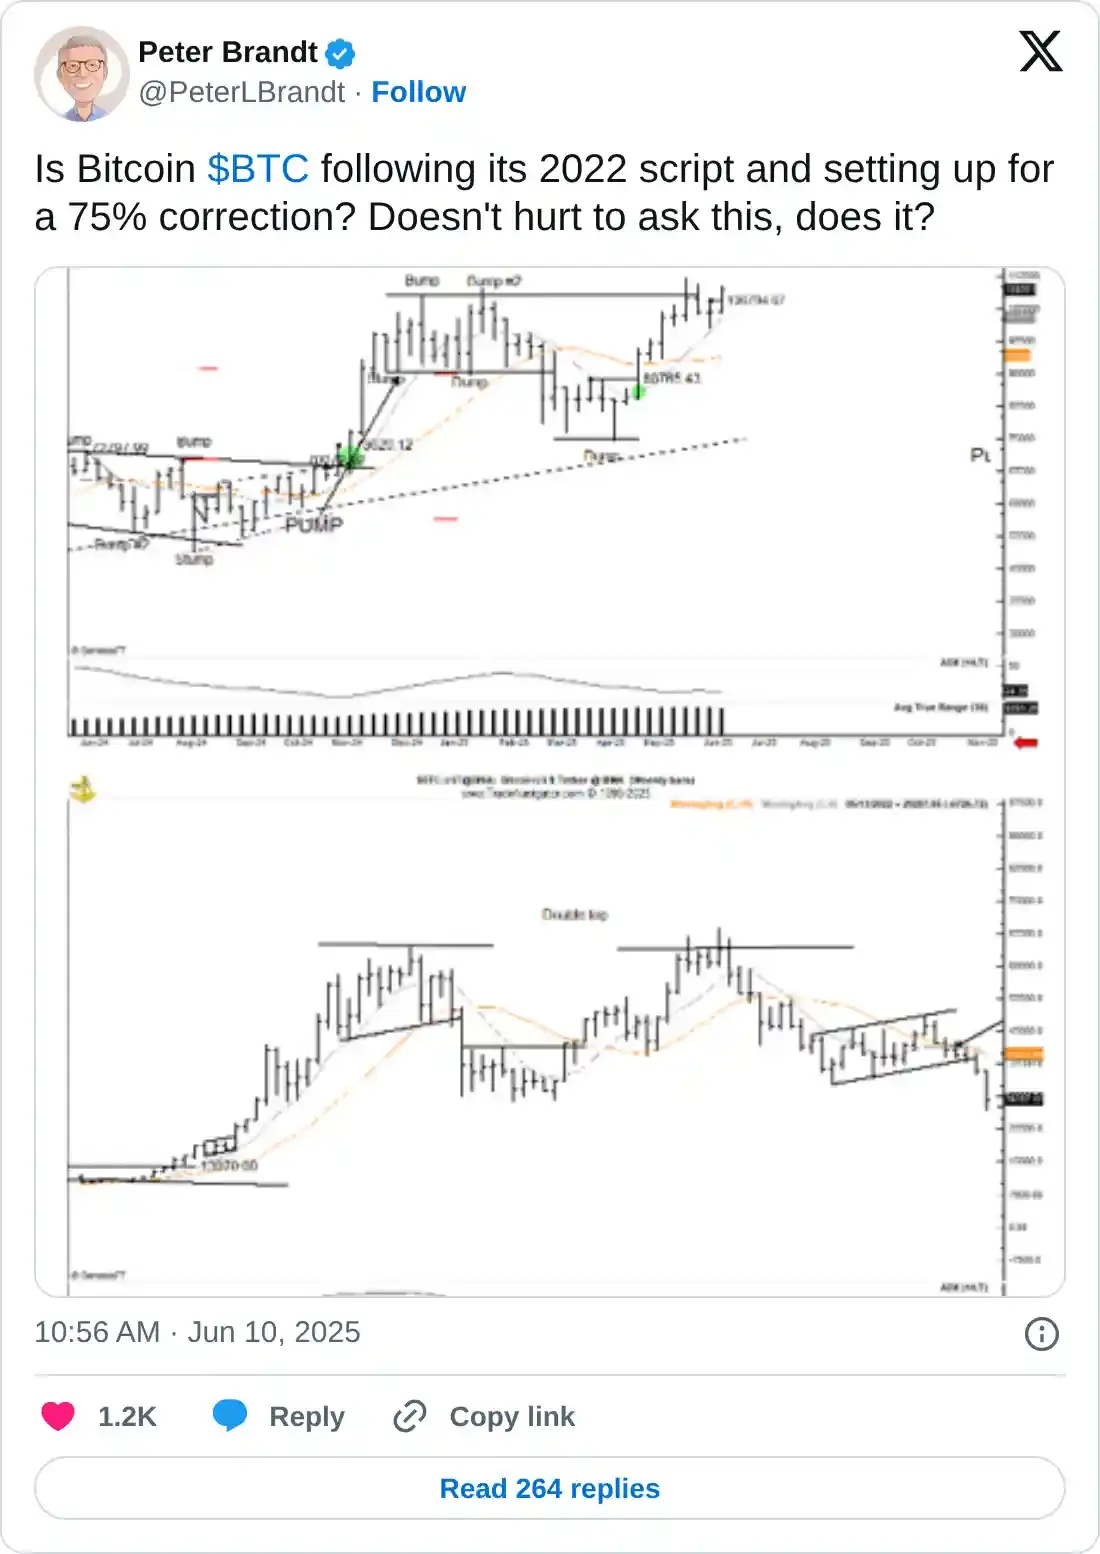
- Veteran analyst Peter Brandt sees upside in ETH and risk in BTC

The ongoing market recovery witnesses a surge in altcoins' market capitalization of over 5% so far this week, increasing the chances of an altseason as Ethereum (ETH) rally outperforms Bitcoin (BTC) in the last 90 days.
An imminent risk of a steep fall in BTC dominance aligns with the Ethereum breakout rally, projecting the start of a new bull cycle in altcoins.
Altcoins outperform Bitcoin
CoinMarketCap’s data of the top 100 coins' performance over the last 90 days shows Ethereum recording a near 48% rise, outpacing Bitcoin’s 31% at press time on Wednesday. Typically, Ethereum and other altcoins rally while Bitcoin remains relatively stable before or during an altcoin season.
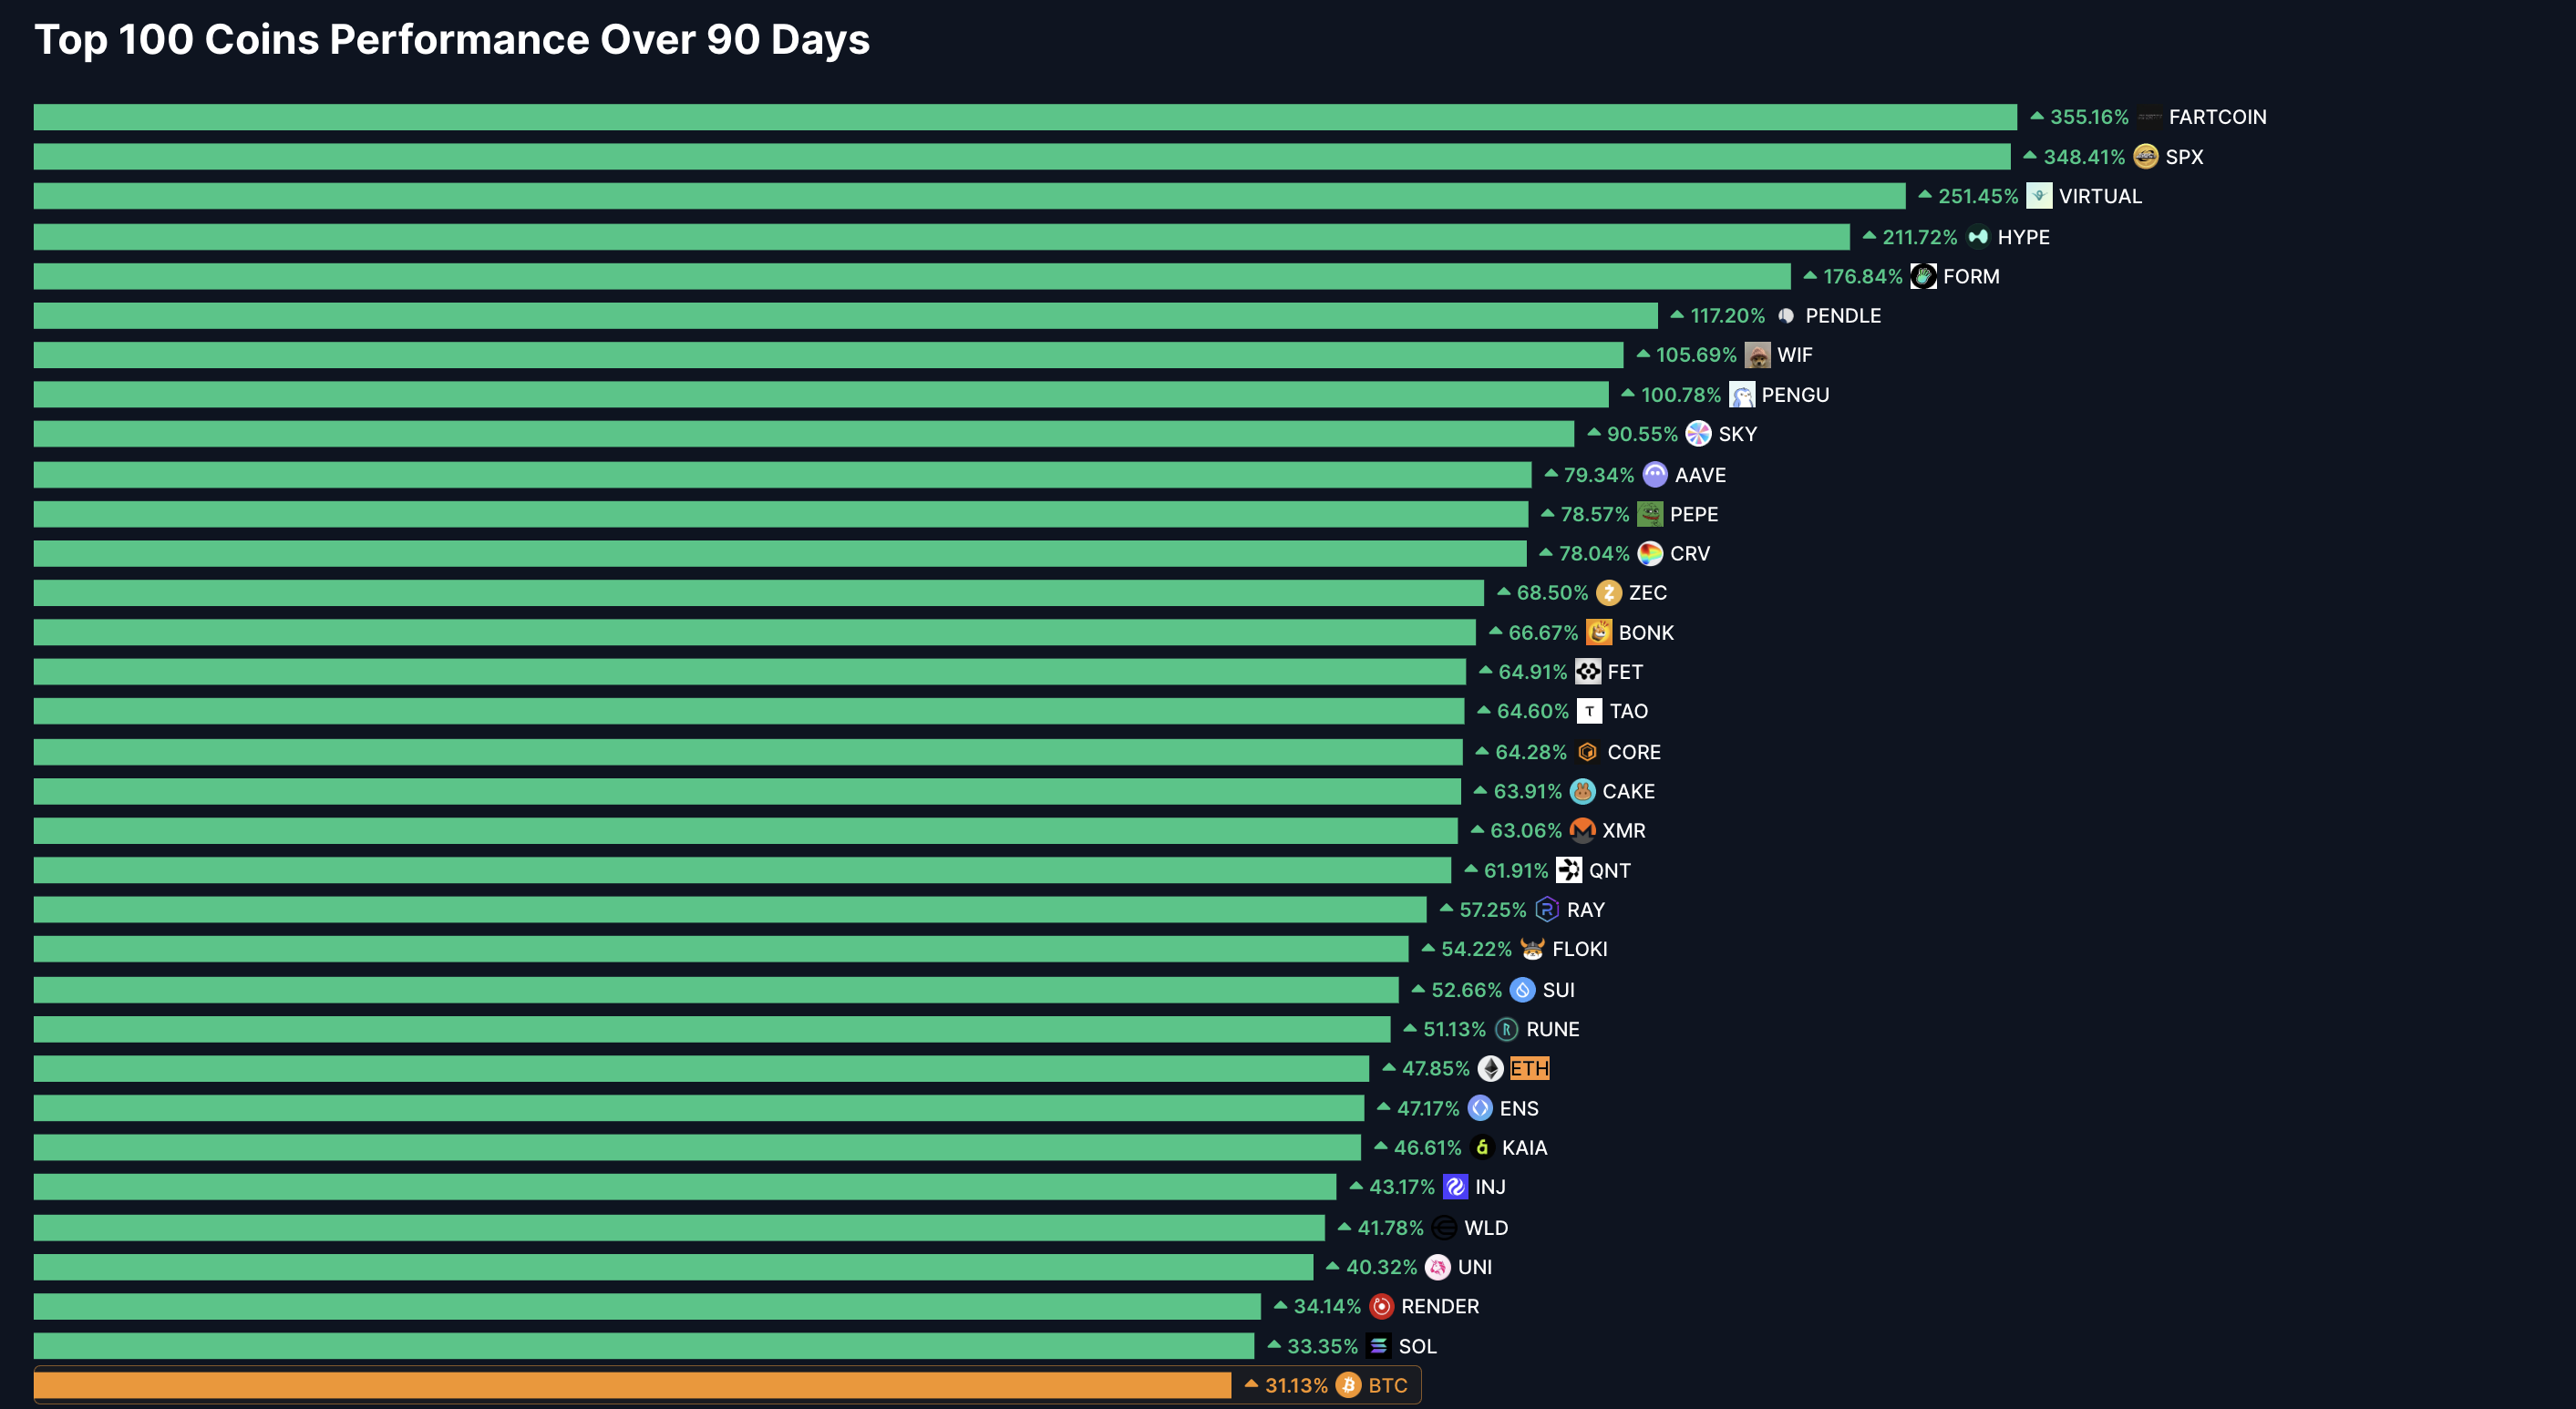
Top 100 coins performance over 90 days. Source: CoinMarketCap
Ethereum gains strength against Bitcoin this week, with a surge of over 7% so far. At the time of writing, the value of a single ETH token is 0.02549 BTC, 44% higher than the year-to-date low of 0.01766 BTC in April 22.
The technical outlook shares an immediate obstacle at 0.02606 BTC, followed by the 0.03020 BTC marked by the previous lowest closing in December 2020 and March 2021.
The Moving Average Convergence/Divergence (MACD) indicator flashes a positive crossover with the signal line in the weekly chart. In addition, the Relative Strength Index (RSI) at 46 indicates fading bearish momentum and sufficient room to increase, which supports a bullish move ahead.
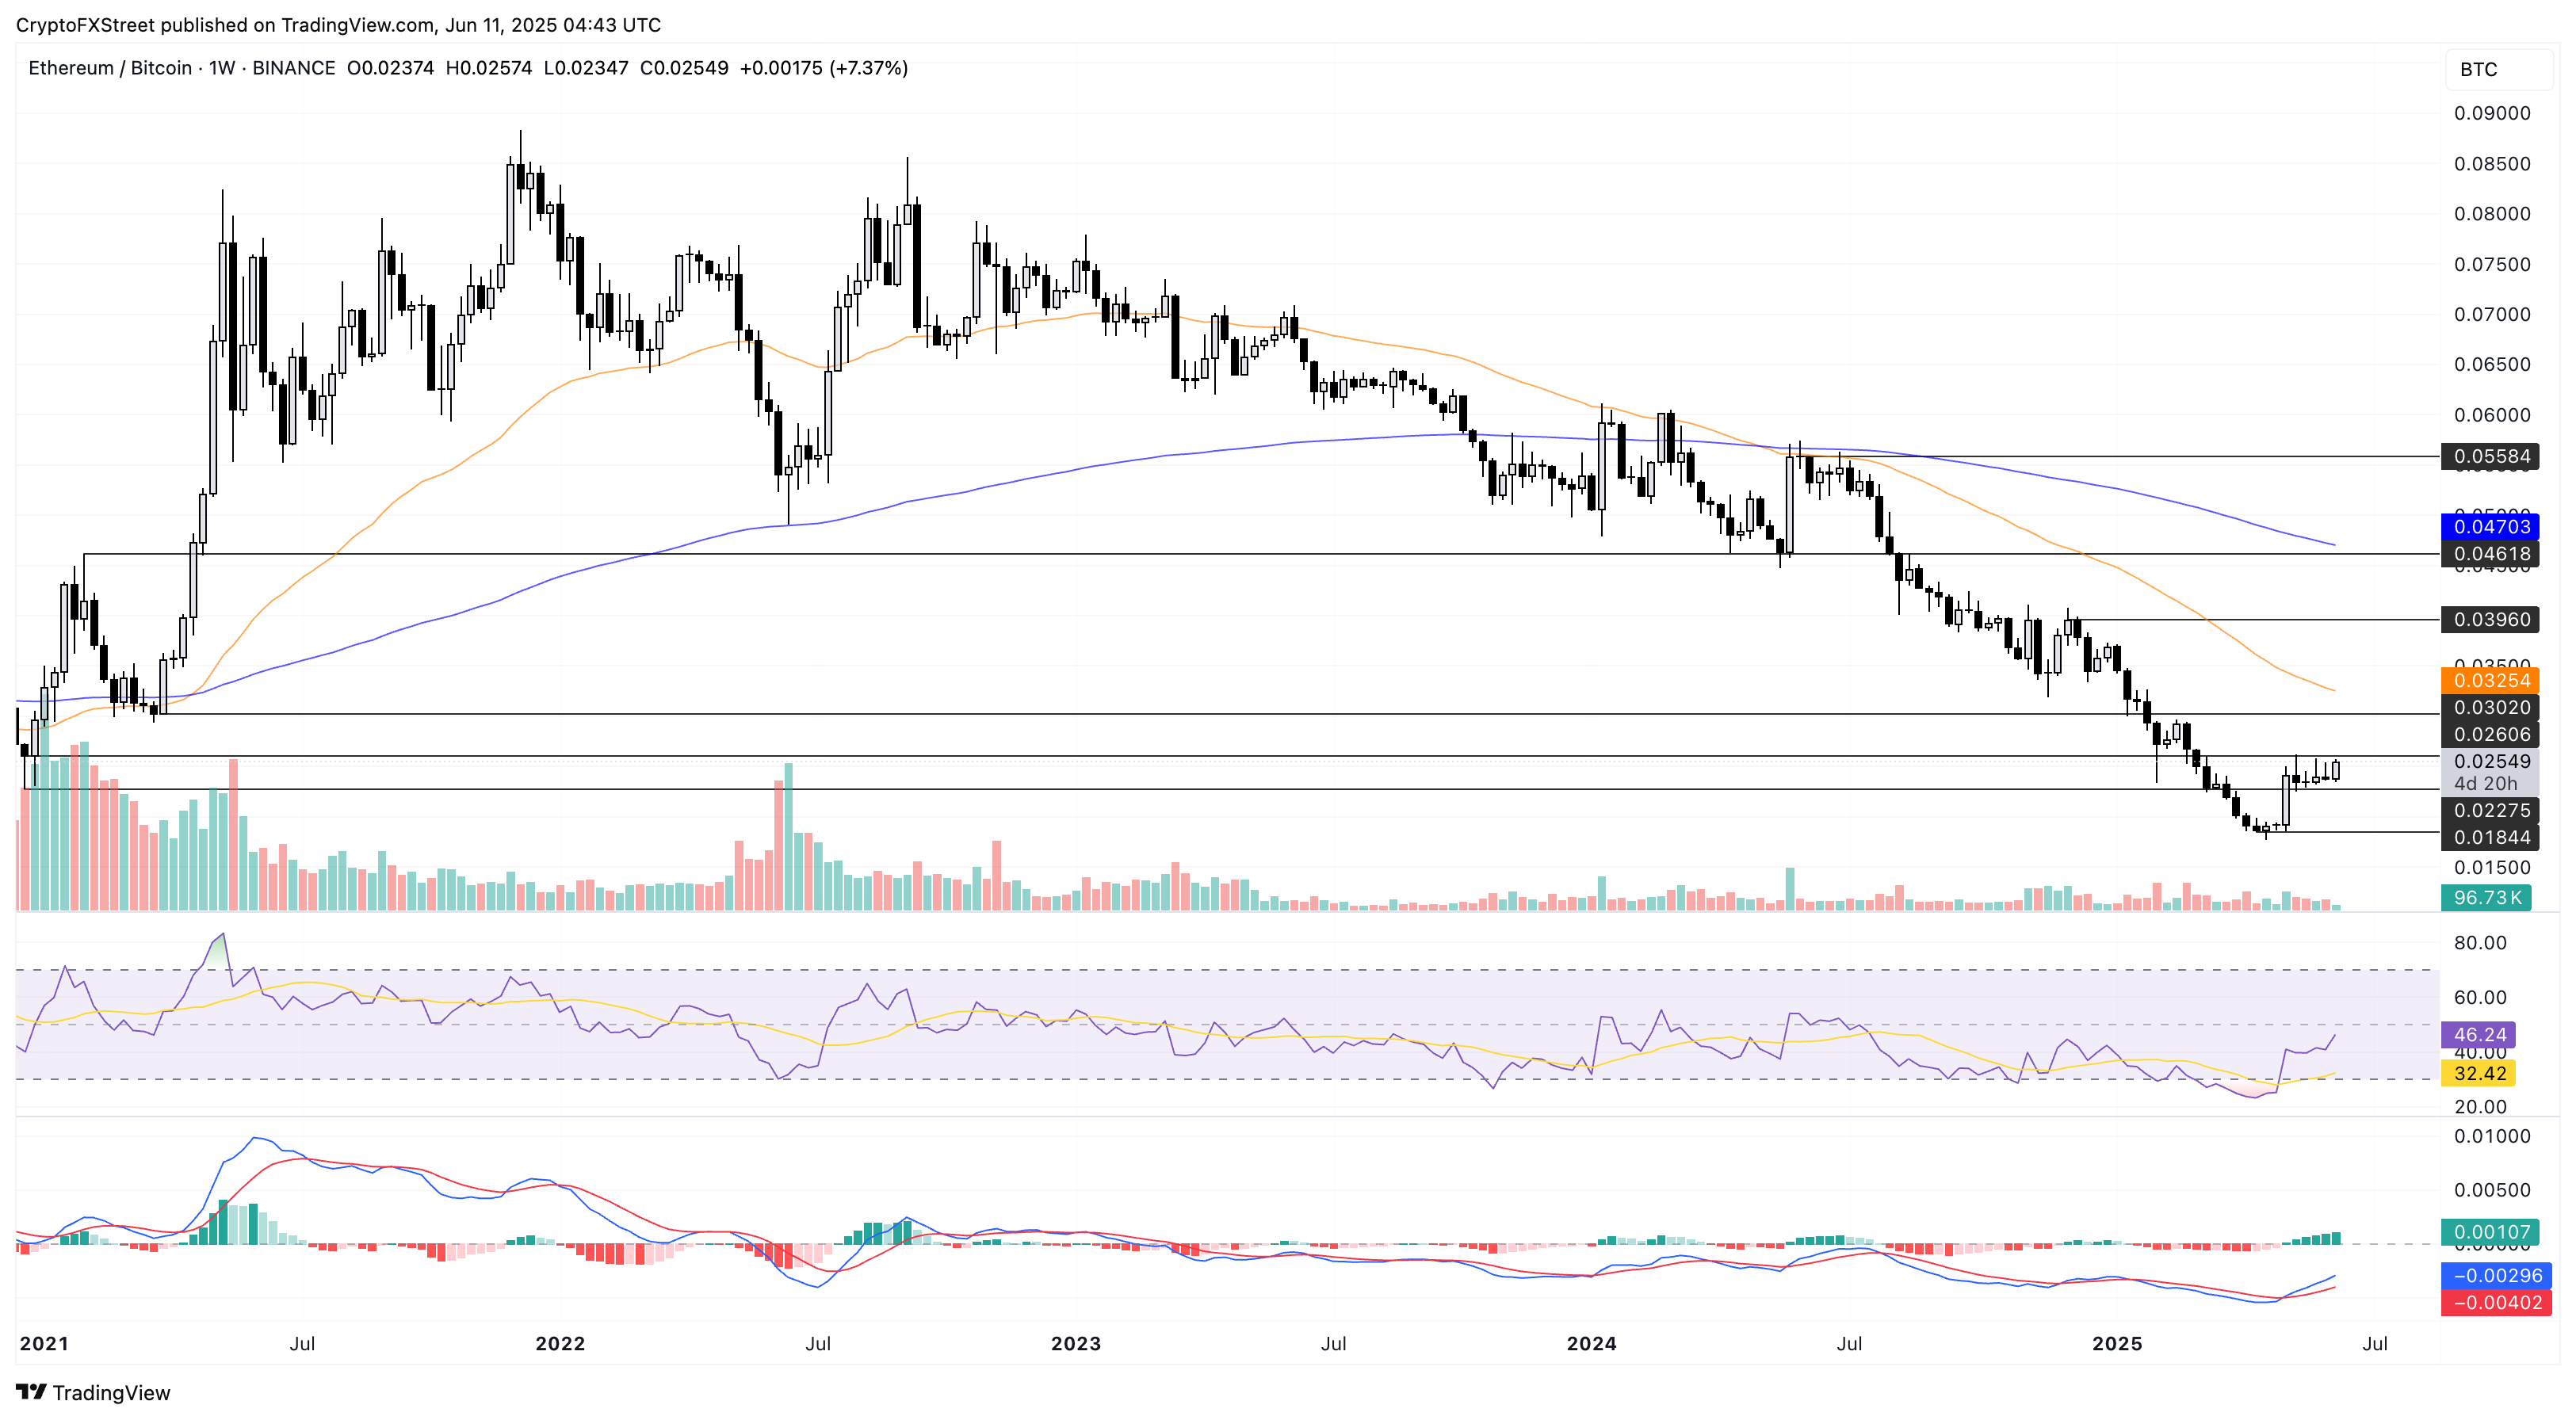
ETH/BTC daily chart.
A surge in Ethereum’s value against Bitcoin is considered an early signal of an altcoin season. Investors can consider such a surge as an indication to acquire top altcoins to avoid missing the rally.
Declining Bitcoin dominance supports altseason chances
During or before an altcoin season begins, the rise in altcoin market capitalization versus a stable or stagnant Bitcoin market capitalization is reflected in the Bitcoin Dominance chart.
Typically, BTC dominance higher than 50% in the cryptocurrency market is considered a Bitcoin Season. Currently, Bitcoin's dominance is facing headwinds above 64%, as it has retracted by almost 1% so far this week.
With a double top formation in the weekly chart, a bearish reversal sign, and paired with bearish divergence in the nearly overbought RSI, the BTC dominance is likely to falter.
A long-coming support trendline could hold the drop at 63.11%, the lowest close in May. A clean push under the trendline could extend the declining trend towards 60.27% to 55.36%, significantly increasing the altcoin season chances.
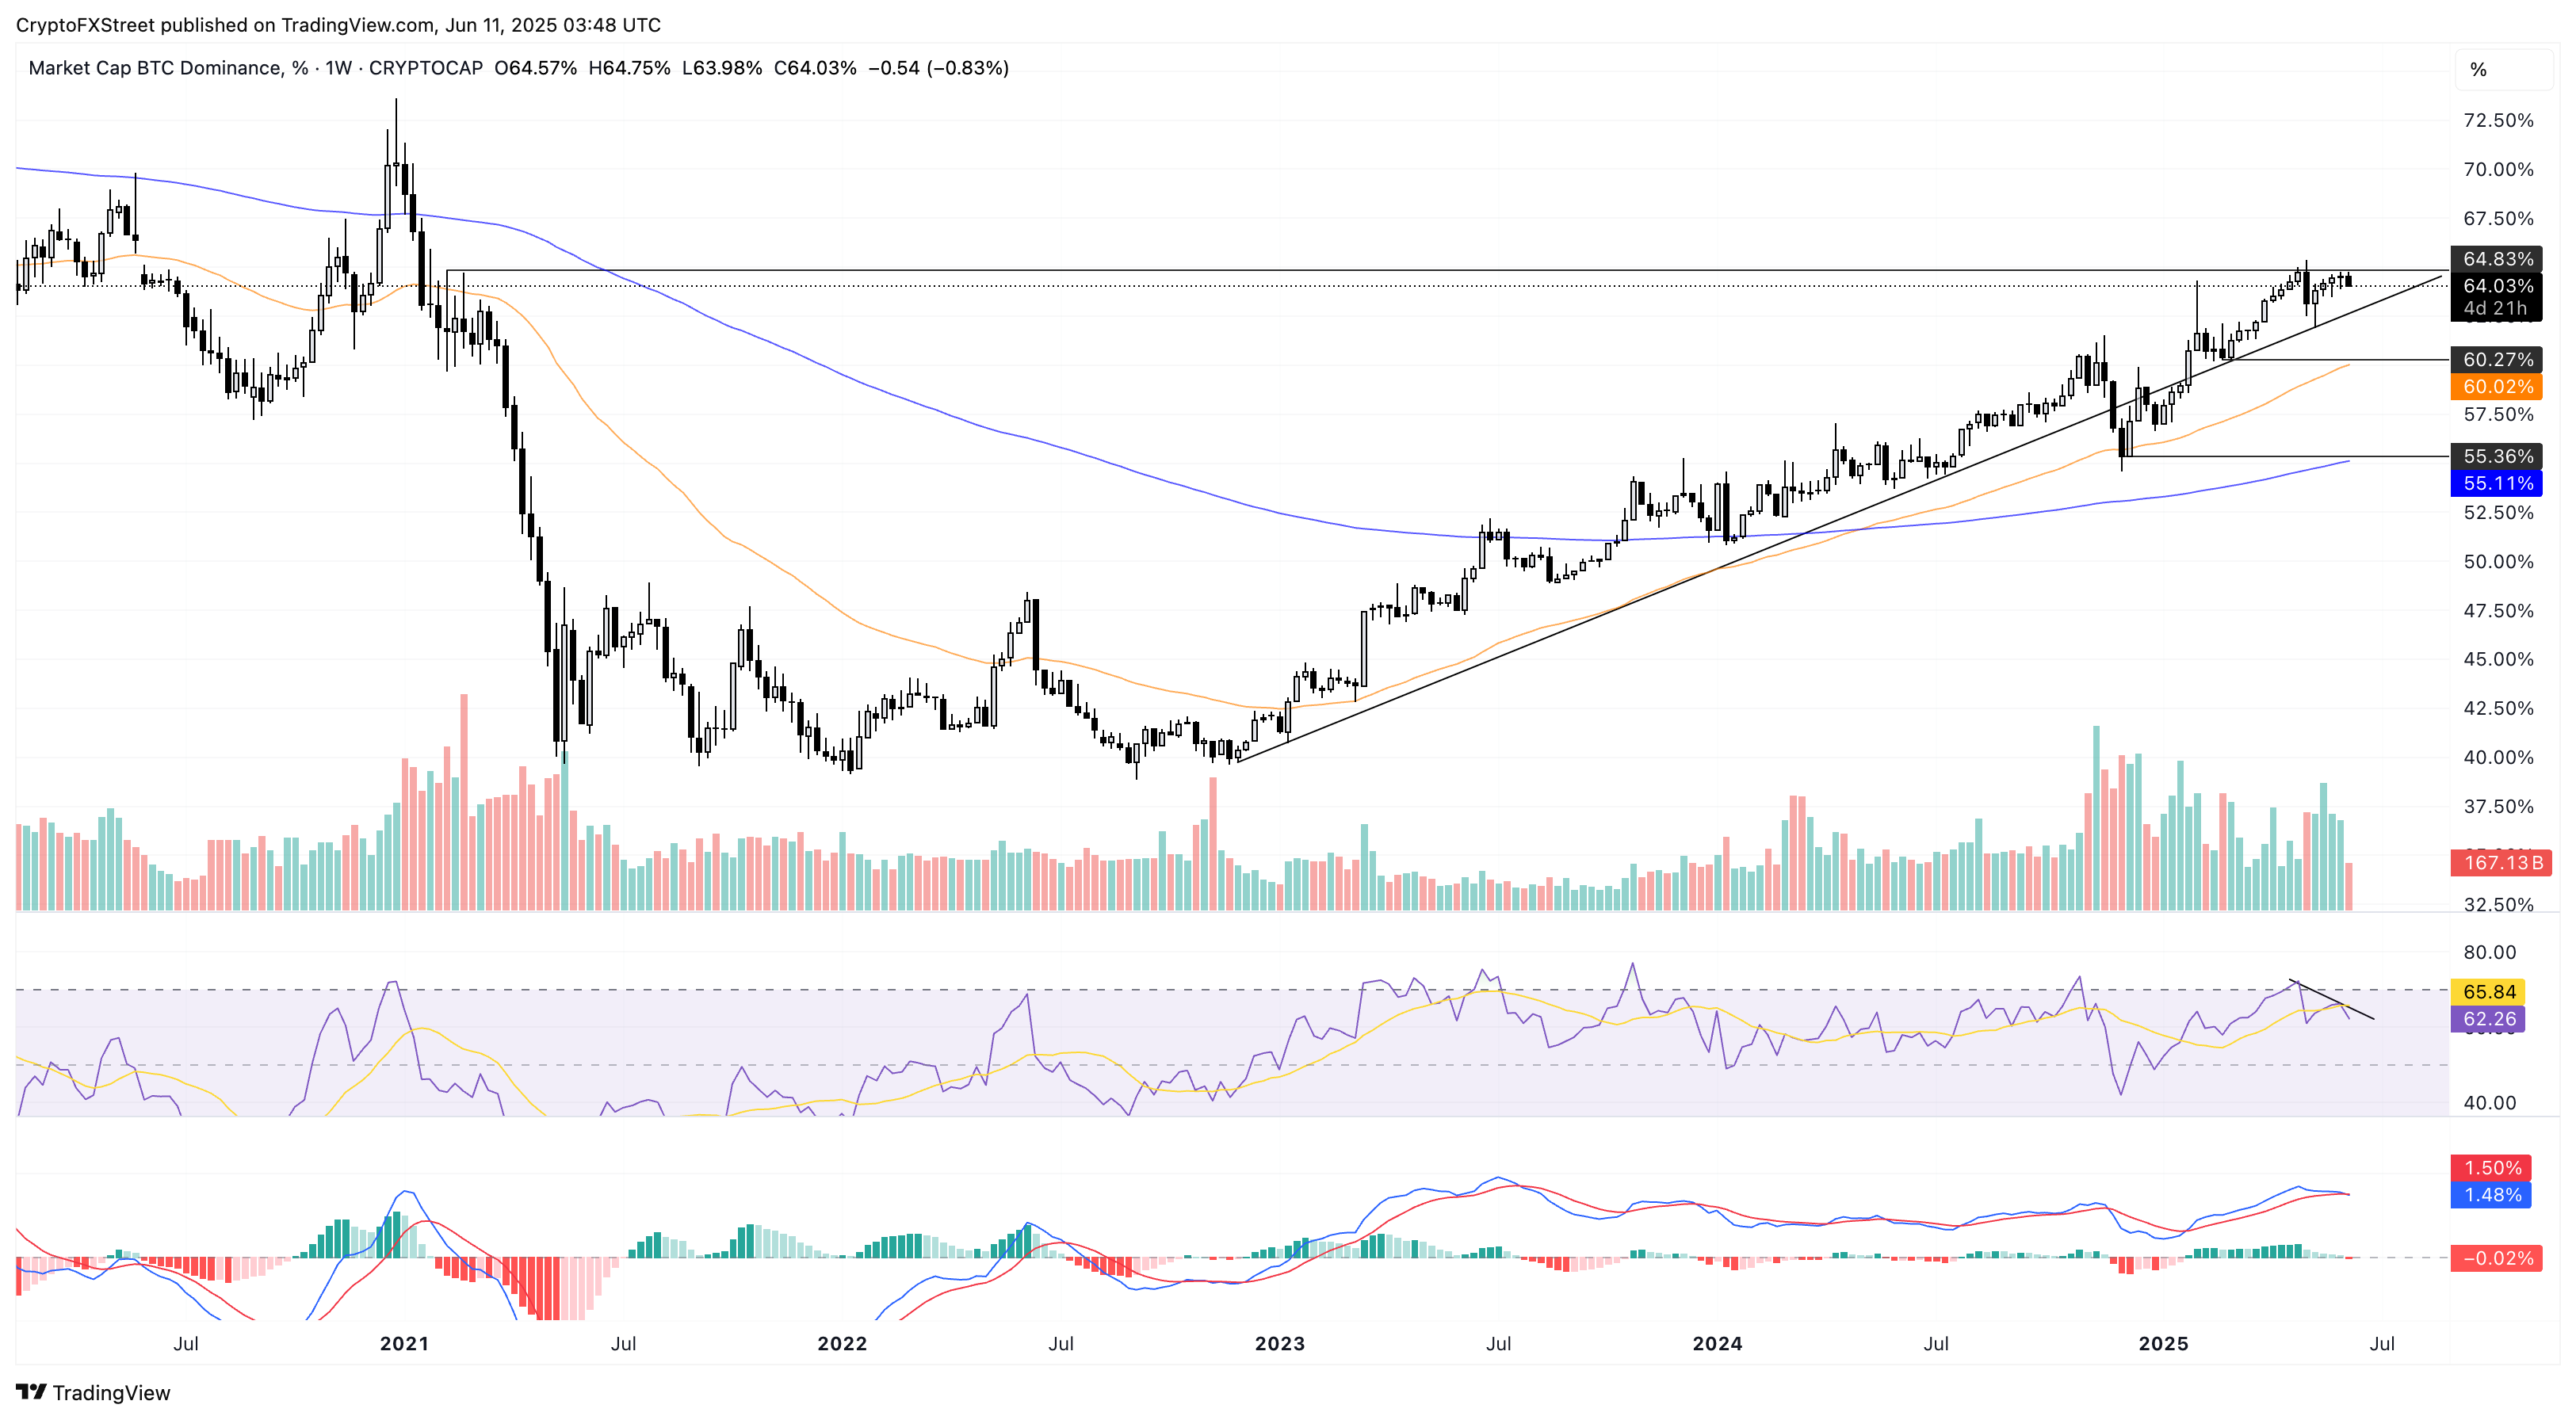
Bitcoin Dominance daily chart.
Additionally, the CoinMarketCap Altcoin Season Index stands at 32, a notable increase from 17 on May 30, suggesting a higher likelihood of an altseason as the Bitcoin season declines. The index tracks the top 100 altcoins' performance relative to Bitcoin over the past 90 days.
A value below 25 indicates strong Bitcoin season while values between 25-50 indicating fading Bitcoin dominace. The index marks the start of an altseason above 75.
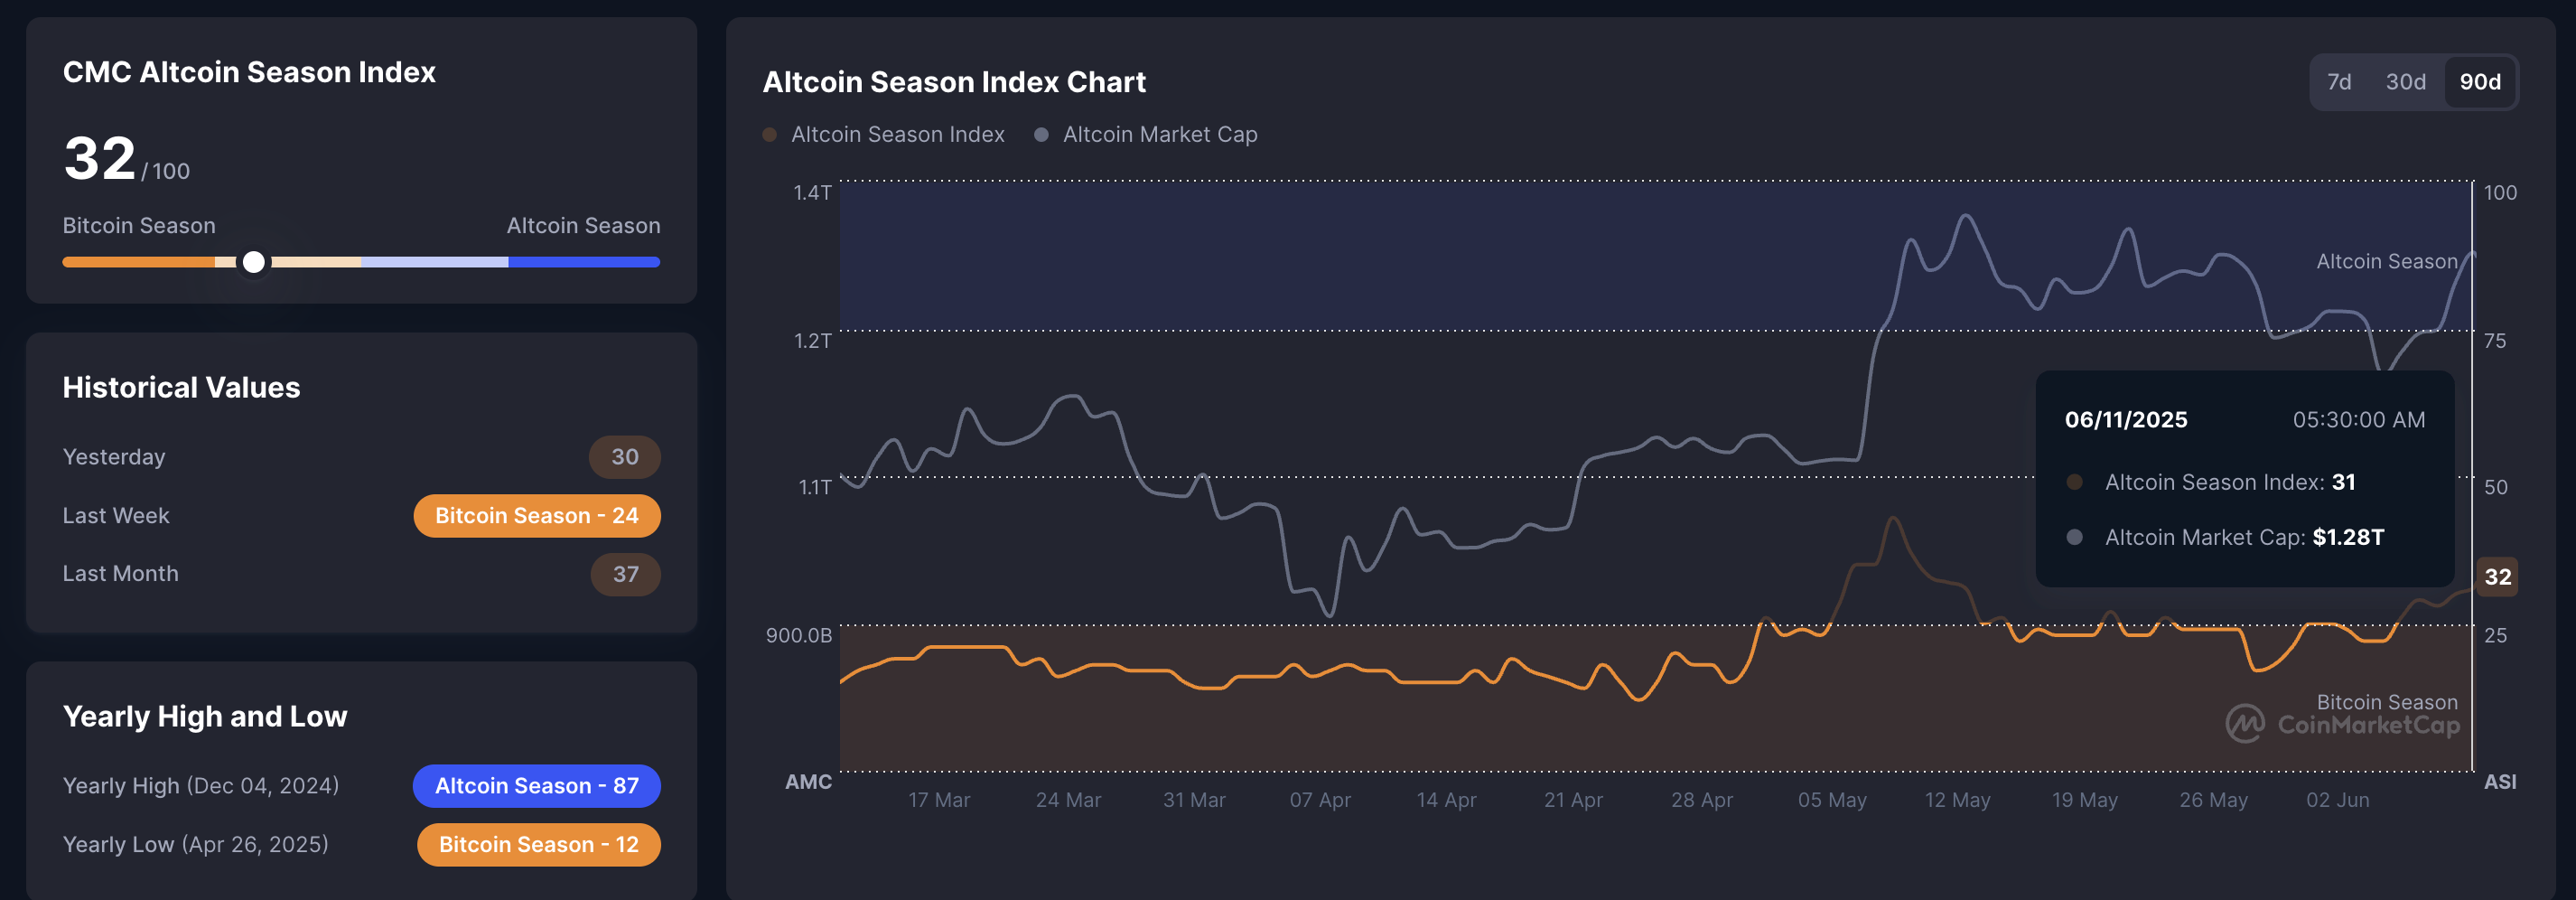
CMC Altcoin Season Index. Source: CoinMarketCap
Veteran analyst indirectly signals altseason ahead
In an X post on Tuesday, Peter Brandt signals a possible reversal risk in Bitcoin similar to the 2022 drop. The analyst questions the possibility of an extended 75% correction as the BTC price action mimics the 2022 double top reversal.
As Bitcoin faces increased volatility above $100,000, the analyst warns of history repeating itself.
However, the analyst in a previous X post projected a potential upside in Ethereum with a range breakout. With a closing price of $2,816 on Tuesday, ETH officially marks a bullish breakout from its sideways range.
Additionally, Ethereum closes above the 50% Fibonacci level at $2,746, retraced from the 52-week high at $4,107 to the year-to-date low at $1,385, and the MACD indicator triggers a buy signal in crossingthe daily chart.
Furthermore, the rising 50-day Exponential Moving Average (EMA) nears the 200-day EMA for a golden cross.
According to Fibonacci levels, the breakout rally in Ethereum could target the 78.6% retracement level at $3,525, projecting massive upside potential. Thus, the bullish trend in the biggest altcoin could fuel the next altseason.
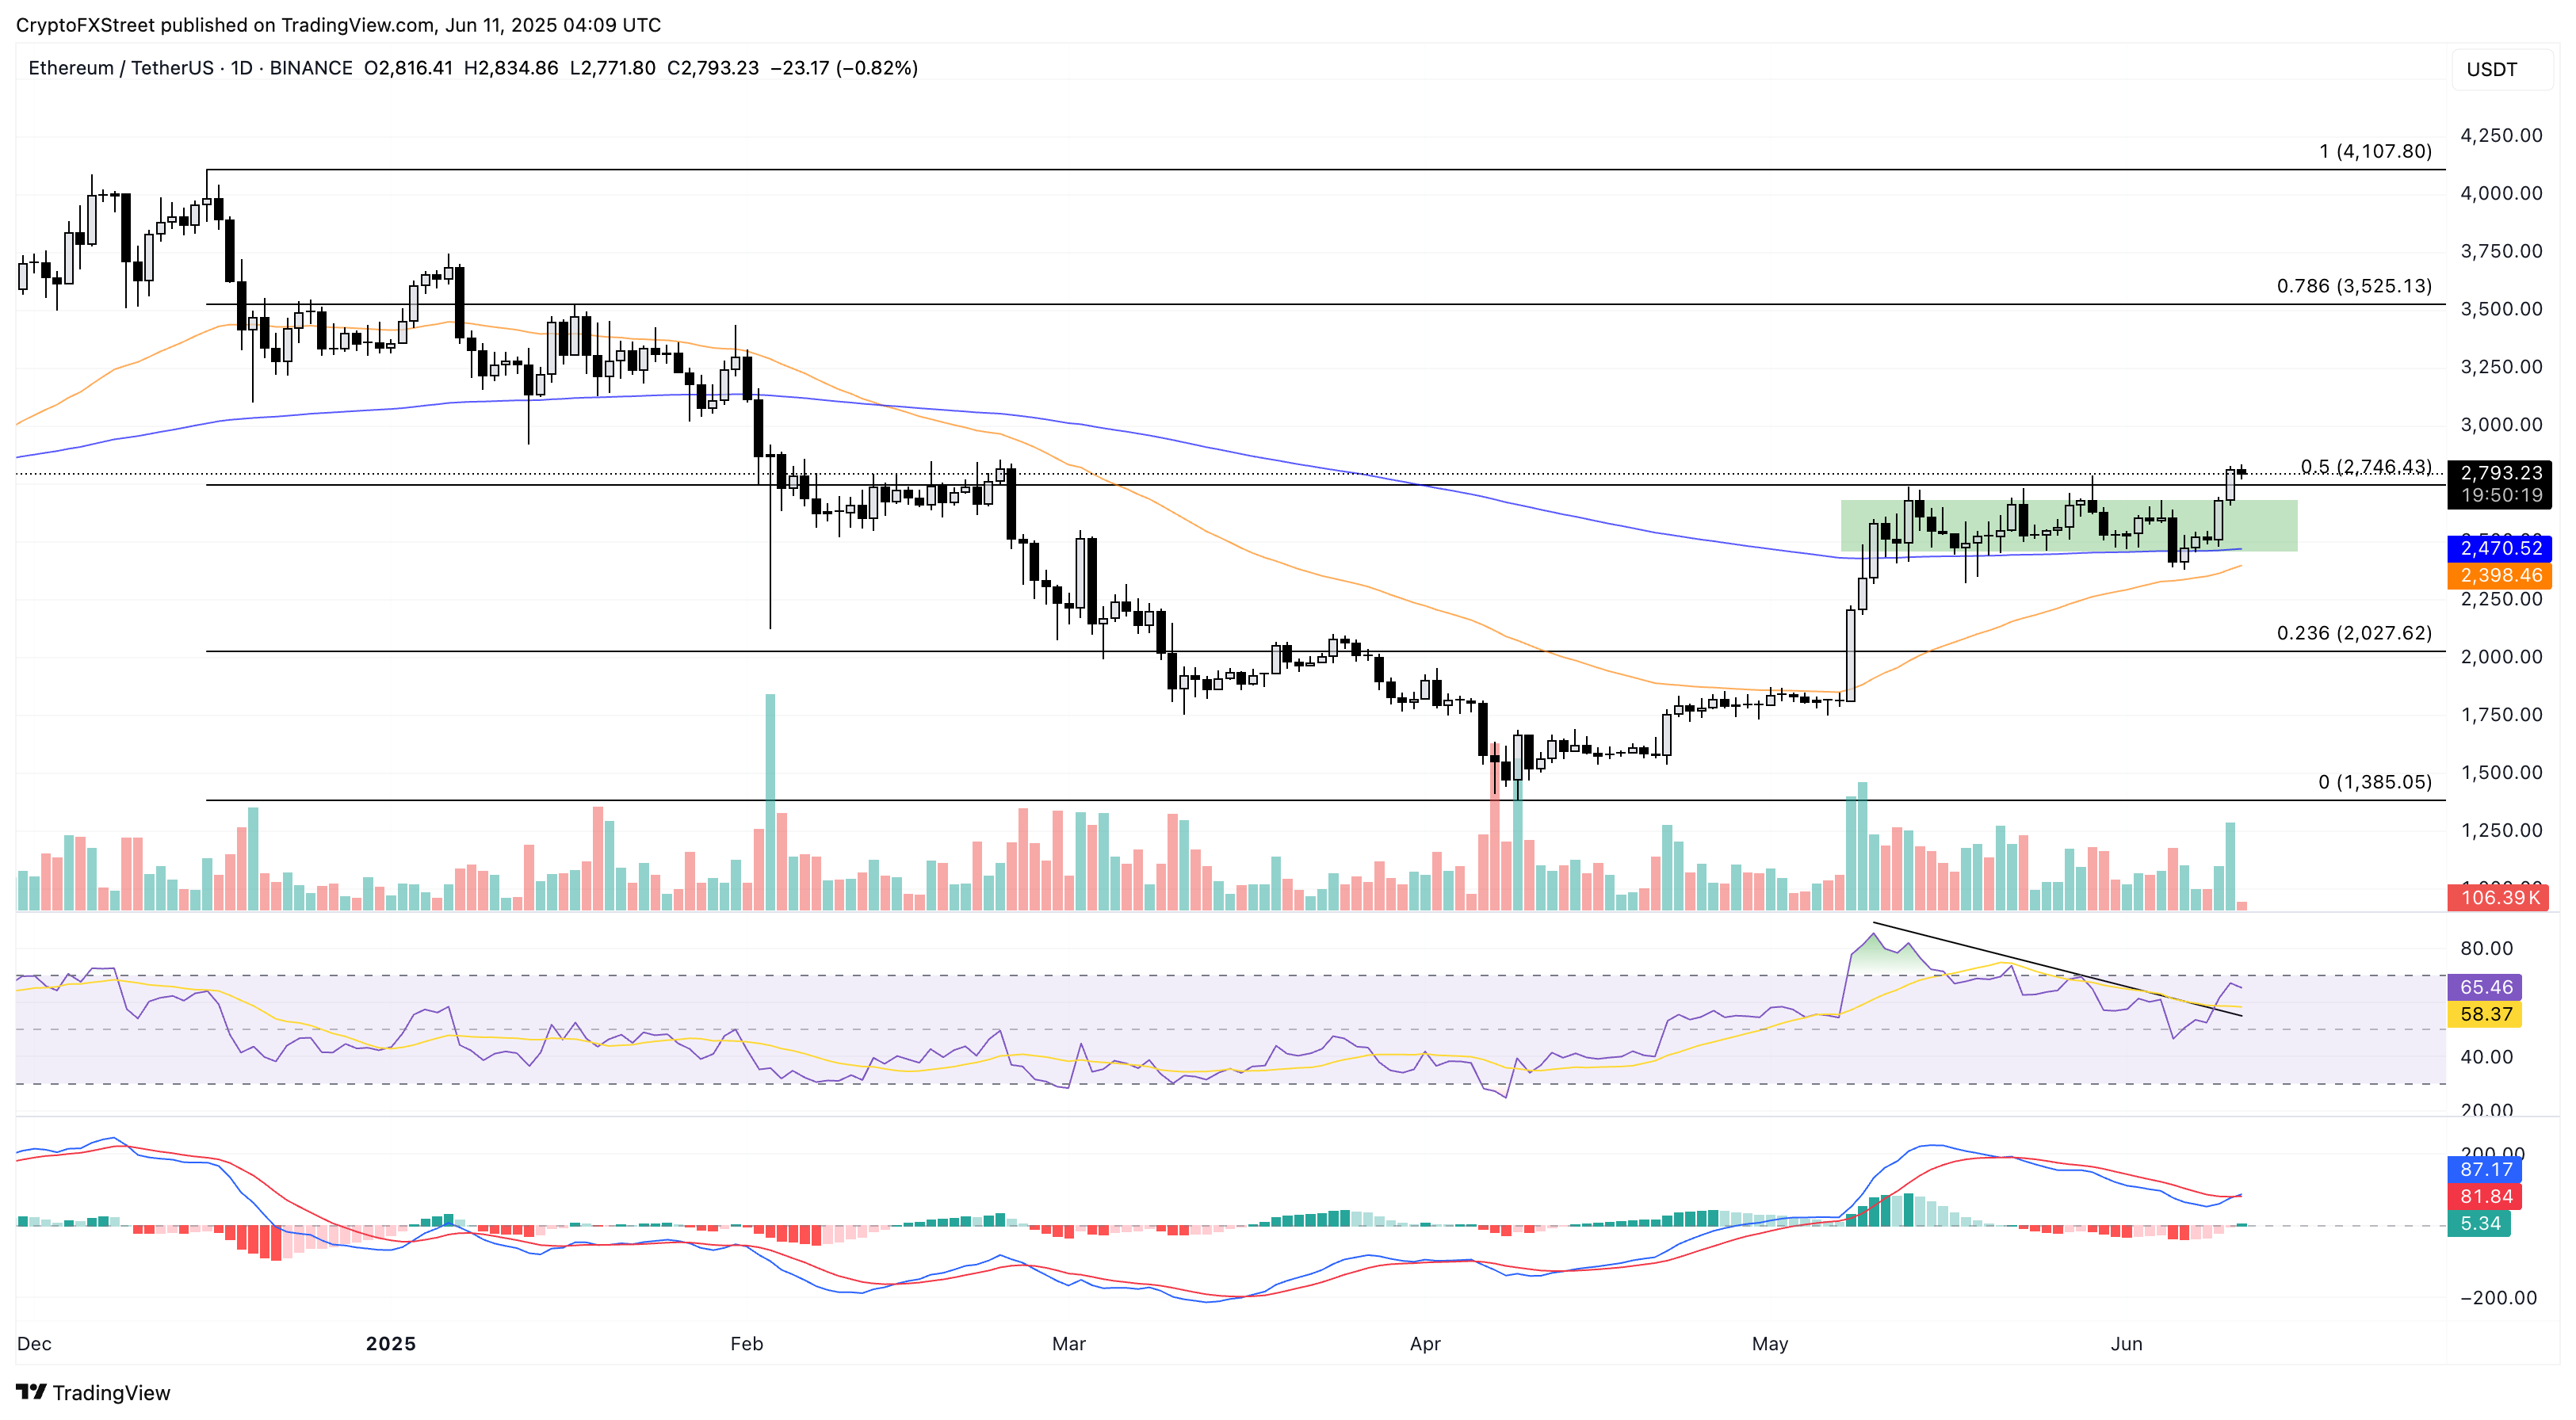
ETH/USDT daily price chart.
However, if Ethereum closes below the 50% Fibonacci level, a steeper correction to the 200-day EMA at $2,470 is possible. This could delay the altcoin season or the arrival of Ethereum in the altseason.
Author

Vishal Dixit
FXStreet
Vishal Dixit holds a B.Sc. in Chemistry from Wilson College but found his true calling in the world of crypto.


