Algorand Price Analysis: ALGO unable to hold weekly gains
- Algorand price rebound appears corrective from the February low.
- Topside trendline complicates a rush to new 2021 highs.
- ALGO is still overbought on the weekly Relative Strength Index (RSI).

Algorand price had been drifting higher in an ascending channel before the sell-off in the cryptocurrency market last week. The downside has been contained by a trifecta of support defined by the 10-week simple moving average (SMA), the psychologically important $1.00, and the 0.236 retracement level of the 2020-2021 bull market at $0.936.
Algorand price clarity being suffocated by a tight price range
At the beginning of February, the height of panic buying, ALGO cleared a topside trendline and later peaked above the 0.786 Fibonacci retracement level of the 2019-2020 bear market. Over the past five weeks, the altcoin has failed to recover the topside trendline lost in the February crash.
The resistance and support levels are obvious in ALGO. Price needs to close above the topside trendline at $1.306 on a weekly basis to raise the neutral bias to bullish. The next target is the 0.786 retracement level at $1.712, followed by the February high at $1.905. If things go well, ALGO could return to the all-time high at $3.774 in the longer term.
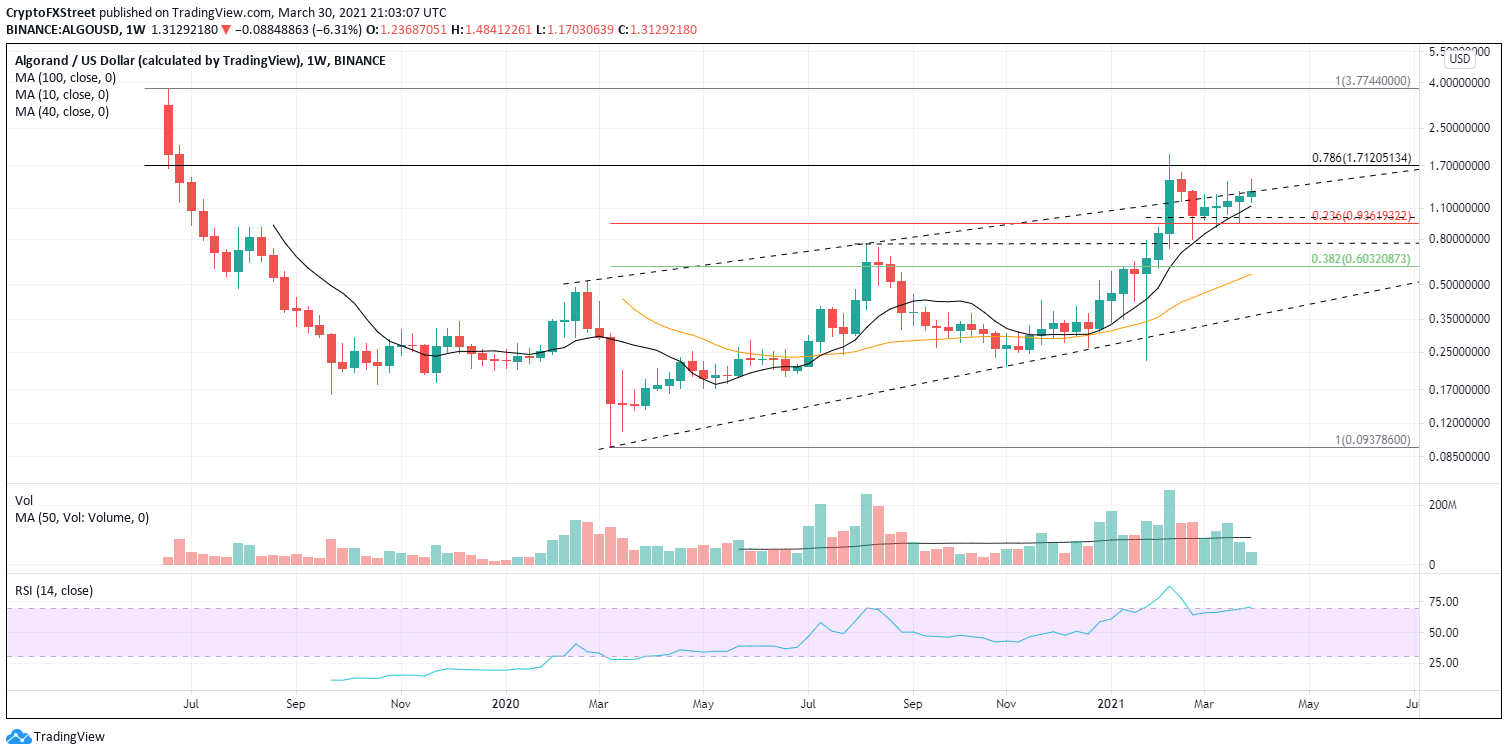
ALGO/USD weekly chart
Equally possible is a weekly close below the trifecta of support mentioned above. A shift to a negative bias would have bears targeting the August 2020 high at $0.767, followed by the 0.382 Fibonacci retracement level of the 2020-2021 bull market at $0.603.
Author

Sheldon McIntyre, CMT
Independent Analyst
Sheldon has 24 years of investment experience holding various positions in companies based in the United States and Chile. His core competencies include BRIC and G-10 equity markets, swing and position trading and technical analysis.


