Aave Price Forecast: AAVE surges, eyeing near-term breakout to $330
- Aave gains toward $270 after testing support at $240, backed by a solid bullish structure.
- Aave ecosystem voted in favor of a decentralized risk mitigation mechanism called Umbrella, designed to protect Aave suppliers from bad debt.
- Aave’s bullish potential could stall with the RSI approaching the overbought region.

Aave’s (AAVE) price has extended the recovery from support at $240, trading at around $268 at the time of writing on Wednesday. Up nearly 2% on the day, AAVE’s uptrend reflects bullish sentiment in the ecosystem following a successful vote on Umbrella, a decentralized solution designed to mitigate risks and support staking on the protocol.
Aave Umbrella activation passes governance vote
The Aave ecosystem has successfully voted to implement Umbrella, a new system designed to introduce new staking tokens tailored to the protocol’s management needs. According to a post on X, Umbrella is scheduled to be activated on Thursday.
Umbrella will allow all users in the ecosystem to stake their own Aave aTokens to earn rewards, while also maintaining Aave yield.
Aave Umbrella also brings forth the concept of deficit offset, such that “before any slashing happens on aToken stakers, there is a configurable variable per asset on how much the Aave DAO treasury covers first.”
The concept is designed to protect users who choose to stake their tokens and earn rewards for protecting the protocol by establishing a form of insurance. This insurance would first slash the network’s capital in case of a deficit before risking the staked funds.
Aave offers bullish breakout signals
Aave’s price shows signs of a major breakout to $330 while knocking on a key descending trendline resistance. This bullish outlook comes after a sharp drop to $240, which mirrored the negative sentiment surrounding the uncertain implementation of United States (US) President Donald Trump’s tariffs.
The Decentralised Finance (DeFi) token is currently positioned significantly above key moving averages, including the 50-day Exponential Moving Average (EMA) at $223, the 100-day EMA at approximately $239, and the 200-day EMA at $208.
Traders will look for a break above the trendline resistance, which would bring key areas of interest into focus, such as the supply zone at $282, tested on May 27, and the resistance at $300, tested in early February.
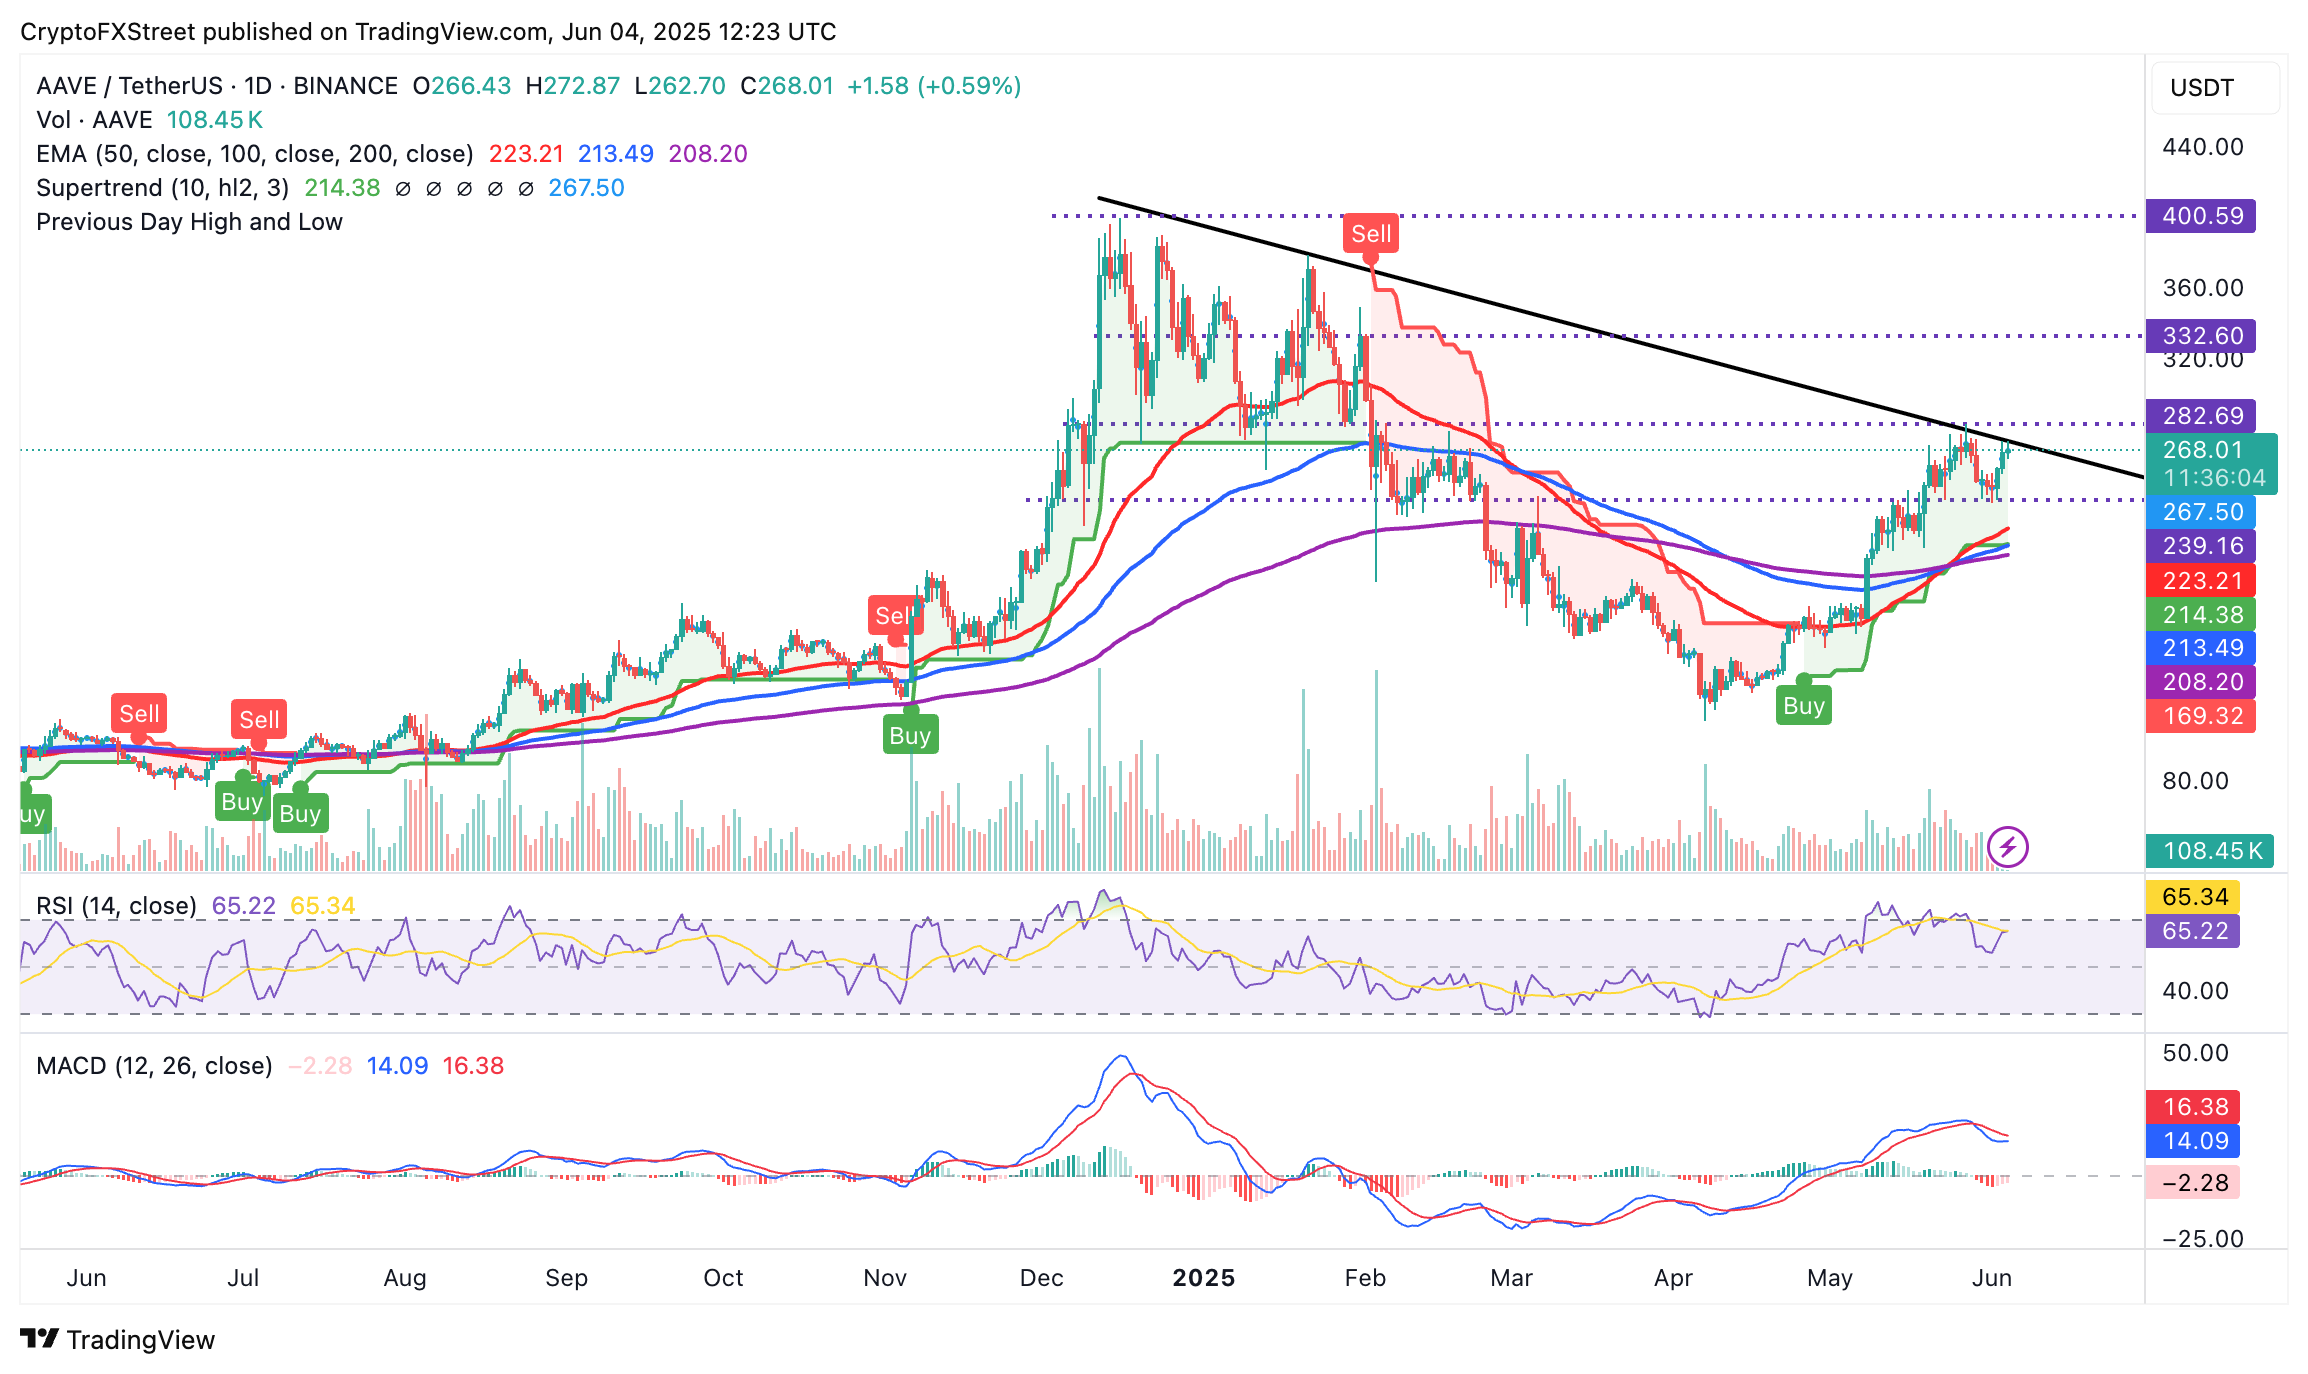
AAVE/USDT daily chart
On the other hand, a sell signal from the Moving Average Convergence Divergence (MACD) indicator introduces an element of risk to the uptrend, potentially encouraging traders to sell AAVE. A pullback will gain momentum if profit-taking takes center stage amid changing market dynamics.
Cryptocurrency prices FAQs
Token launches influence demand and adoption among market participants. Listings on crypto exchanges deepen the liquidity for an asset and add new participants to an asset’s network. This is typically bullish for a digital asset.
A hack is an event in which an attacker captures a large volume of the asset from a DeFi bridge or hot wallet of an exchange or any other crypto platform via exploits, bugs or other methods. The exploiter then transfers these tokens out of the exchange platforms to ultimately sell or swap the assets for other cryptocurrencies or stablecoins. Such events often involve an en masse panic triggering a sell-off in the affected assets.
Macroeconomic events like the US Federal Reserve’s decision on interest rates influence crypto assets mainly through the direct impact they have on the US Dollar. An increase in interest rate typically negatively influences Bitcoin and altcoin prices, and vice versa. If the US Dollar index declines, risk assets and associated leverage for trading gets cheaper, in turn driving crypto prices higher.
Halvings are typically considered bullish events as they slash the block reward in half for miners, constricting the supply of the asset. At consistent demand if the supply reduces, the asset’s price climbs.
Author

John Isige
FXStreet
John Isige is a seasoned cryptocurrency journalist and markets analyst committed to delivering high-quality, actionable insights tailored to traders, investors, and crypto enthusiasts. He enjoys deep dives into emerging Web3 tren


