1 Crypto to Long, 1 to Short: Buy Tezos, sell Monero
- Tezos seems to be showing signs of a reversal on the daily chart.
- Monero could be close to the top, indicating a potential reversal is coming.

Let's look at the bullish perspective for Tezos and the bearish scenario for Monero in the short-term. Both currencies are showing reasonably clear signs of a bounce and a reversal, respectively.
Is Tezos bottom in?
XTZ is currently trading at $2.14 after defending what seems to be a long-term trendline touched several times in the past on September 22, March, and even in October 2019.
XTZ/USD daily chart
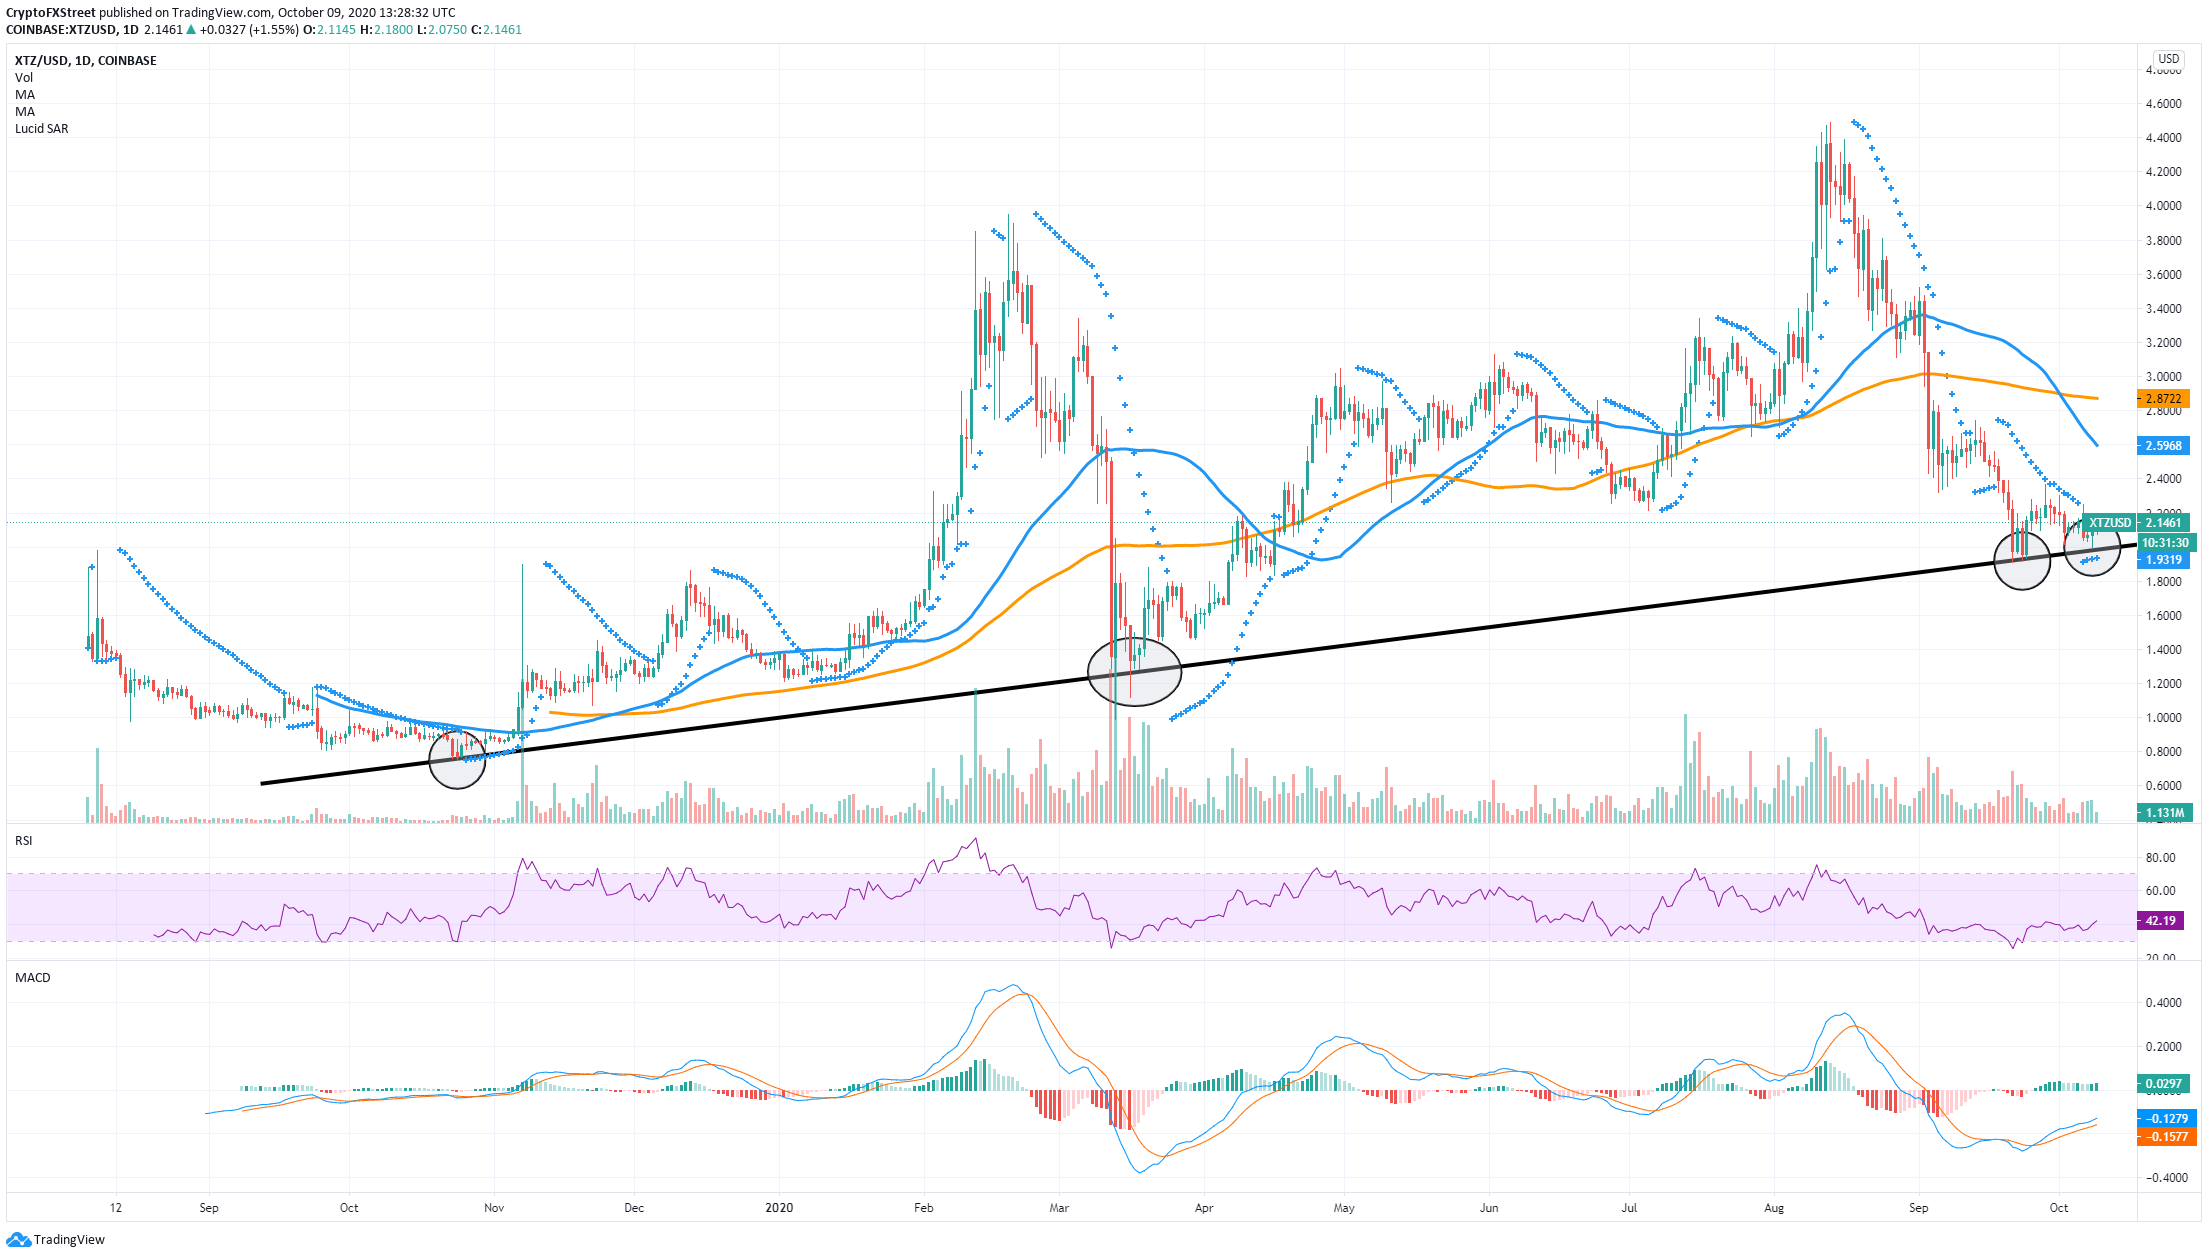
Additionally, the Parabolic Stop and Reverse Points (SAR) turned bullish, which further confirms the theory that the direction of the downtrend is changing.
XTZ Volume
 [15.27.56, 09 Oct, 2020]-637378494733701036.png)
Furthermore, although the trading volume has been declining since the beginning of September, Tezos has seen a significant spike in volume over the past three days after successfully defending the long-term trendline support.
XTZ/USD 4-hour chart
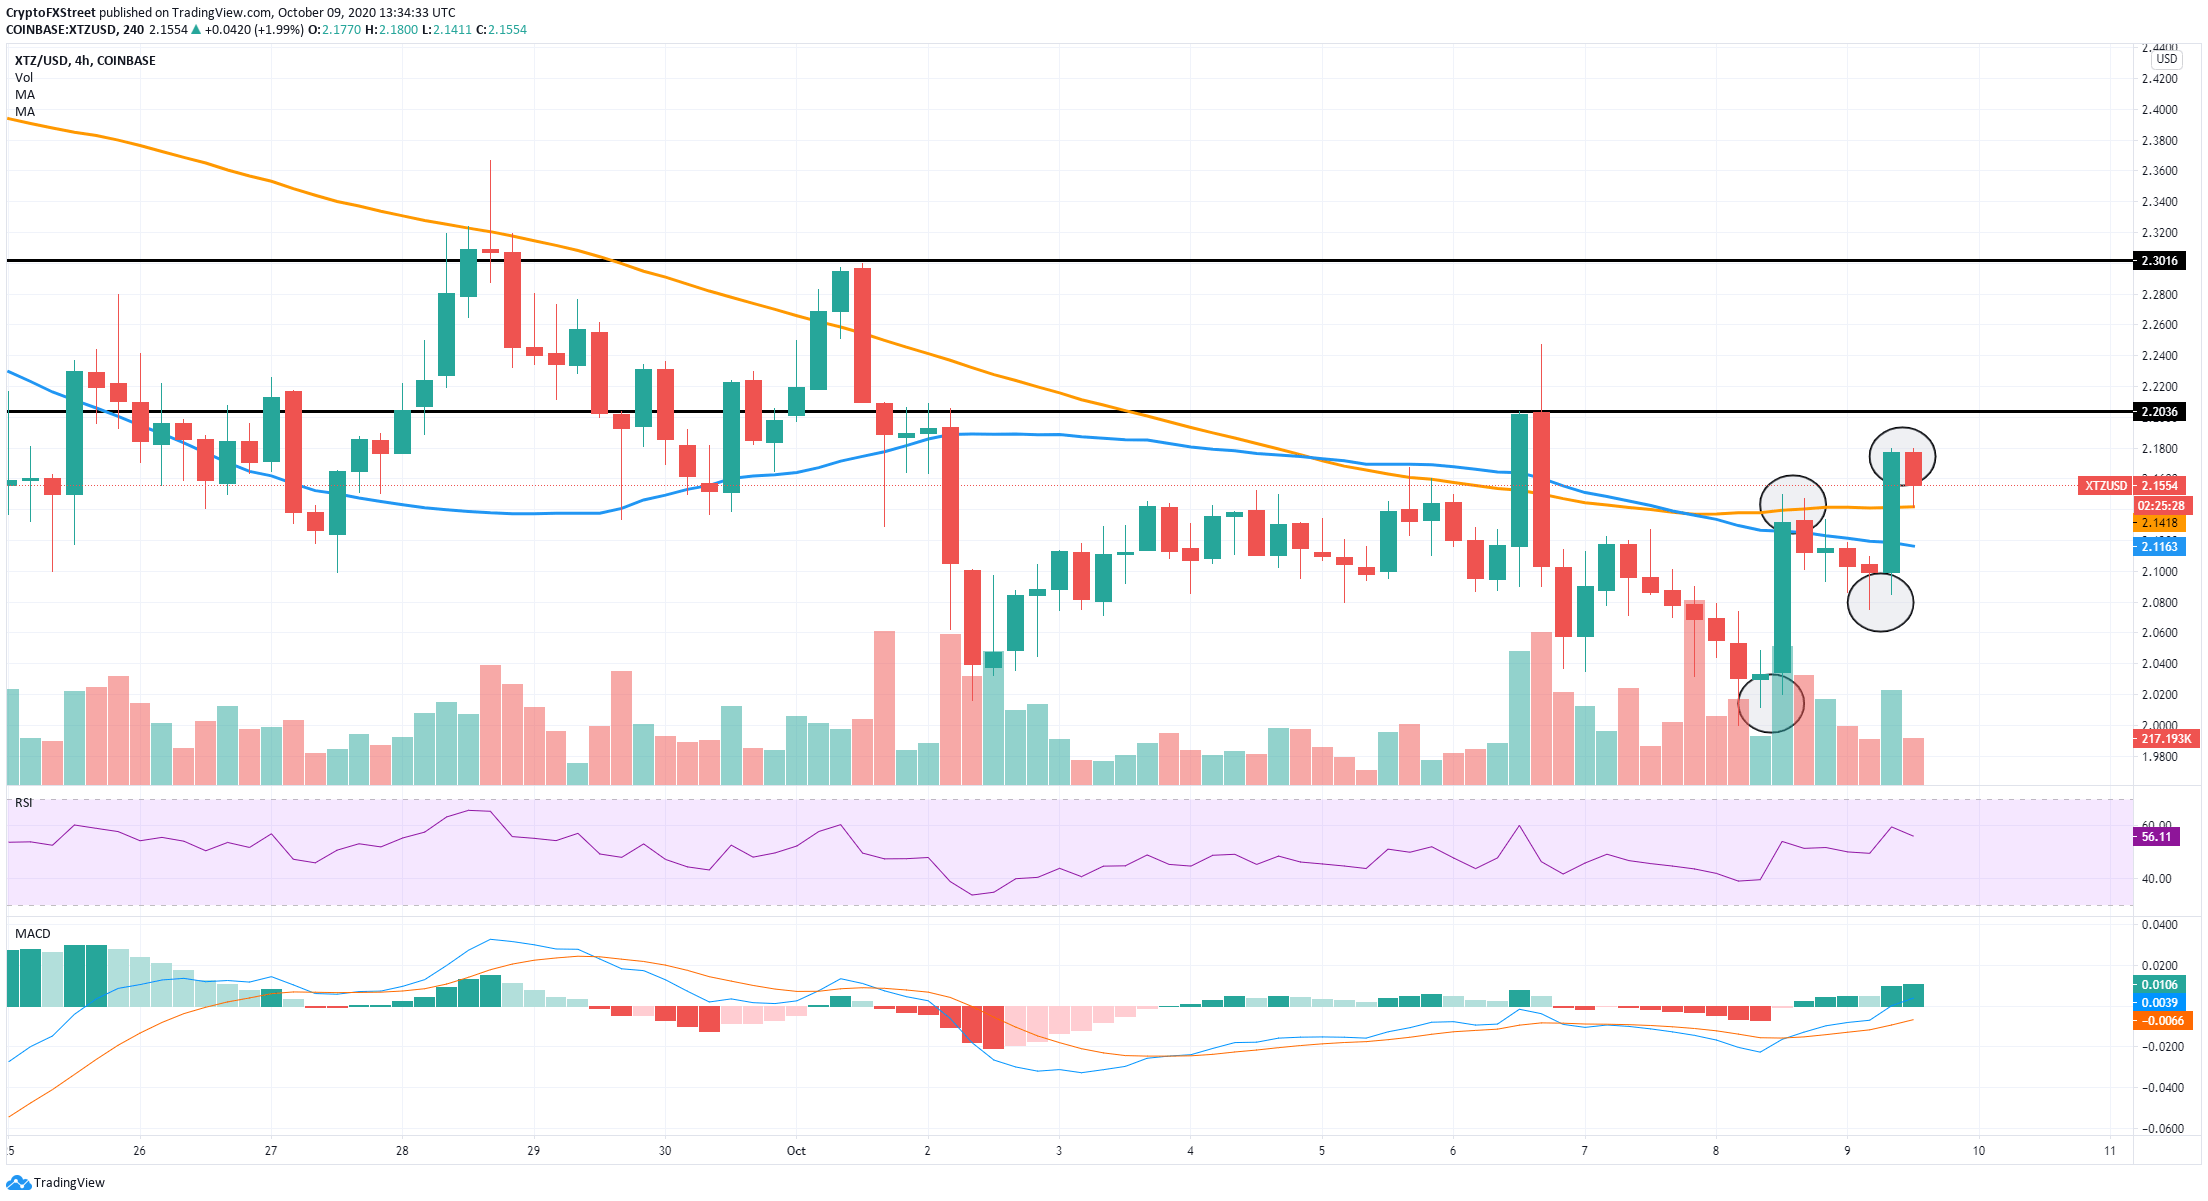
On the 4-hour chart, bulls show a lot of strength after the MACD crossed bullishly and the price climbed above the 50-SMA and the 100-SMA, turning both into support levels. In the short-term, there are several key resistance levels located at $2.2 and $2.3
It's also worth noting that XTZ established a higher low at $2.07 compared to the previous at $2, and a high at $2.15, followed by a higher high at $2.18, confirming a 4-hour uptrend.
The daily chart shows a possible target price of $2.6 where the 50-SMA is located; however, bulls could eye up even $2.87, the 100-SMA.
Several indicators are showing Monero potentially looking at a reversal
XMR is trading at $112, hinting at a potential reversal period after just establishing a new 2020-high at $114.
XMR/USD 3-day chart
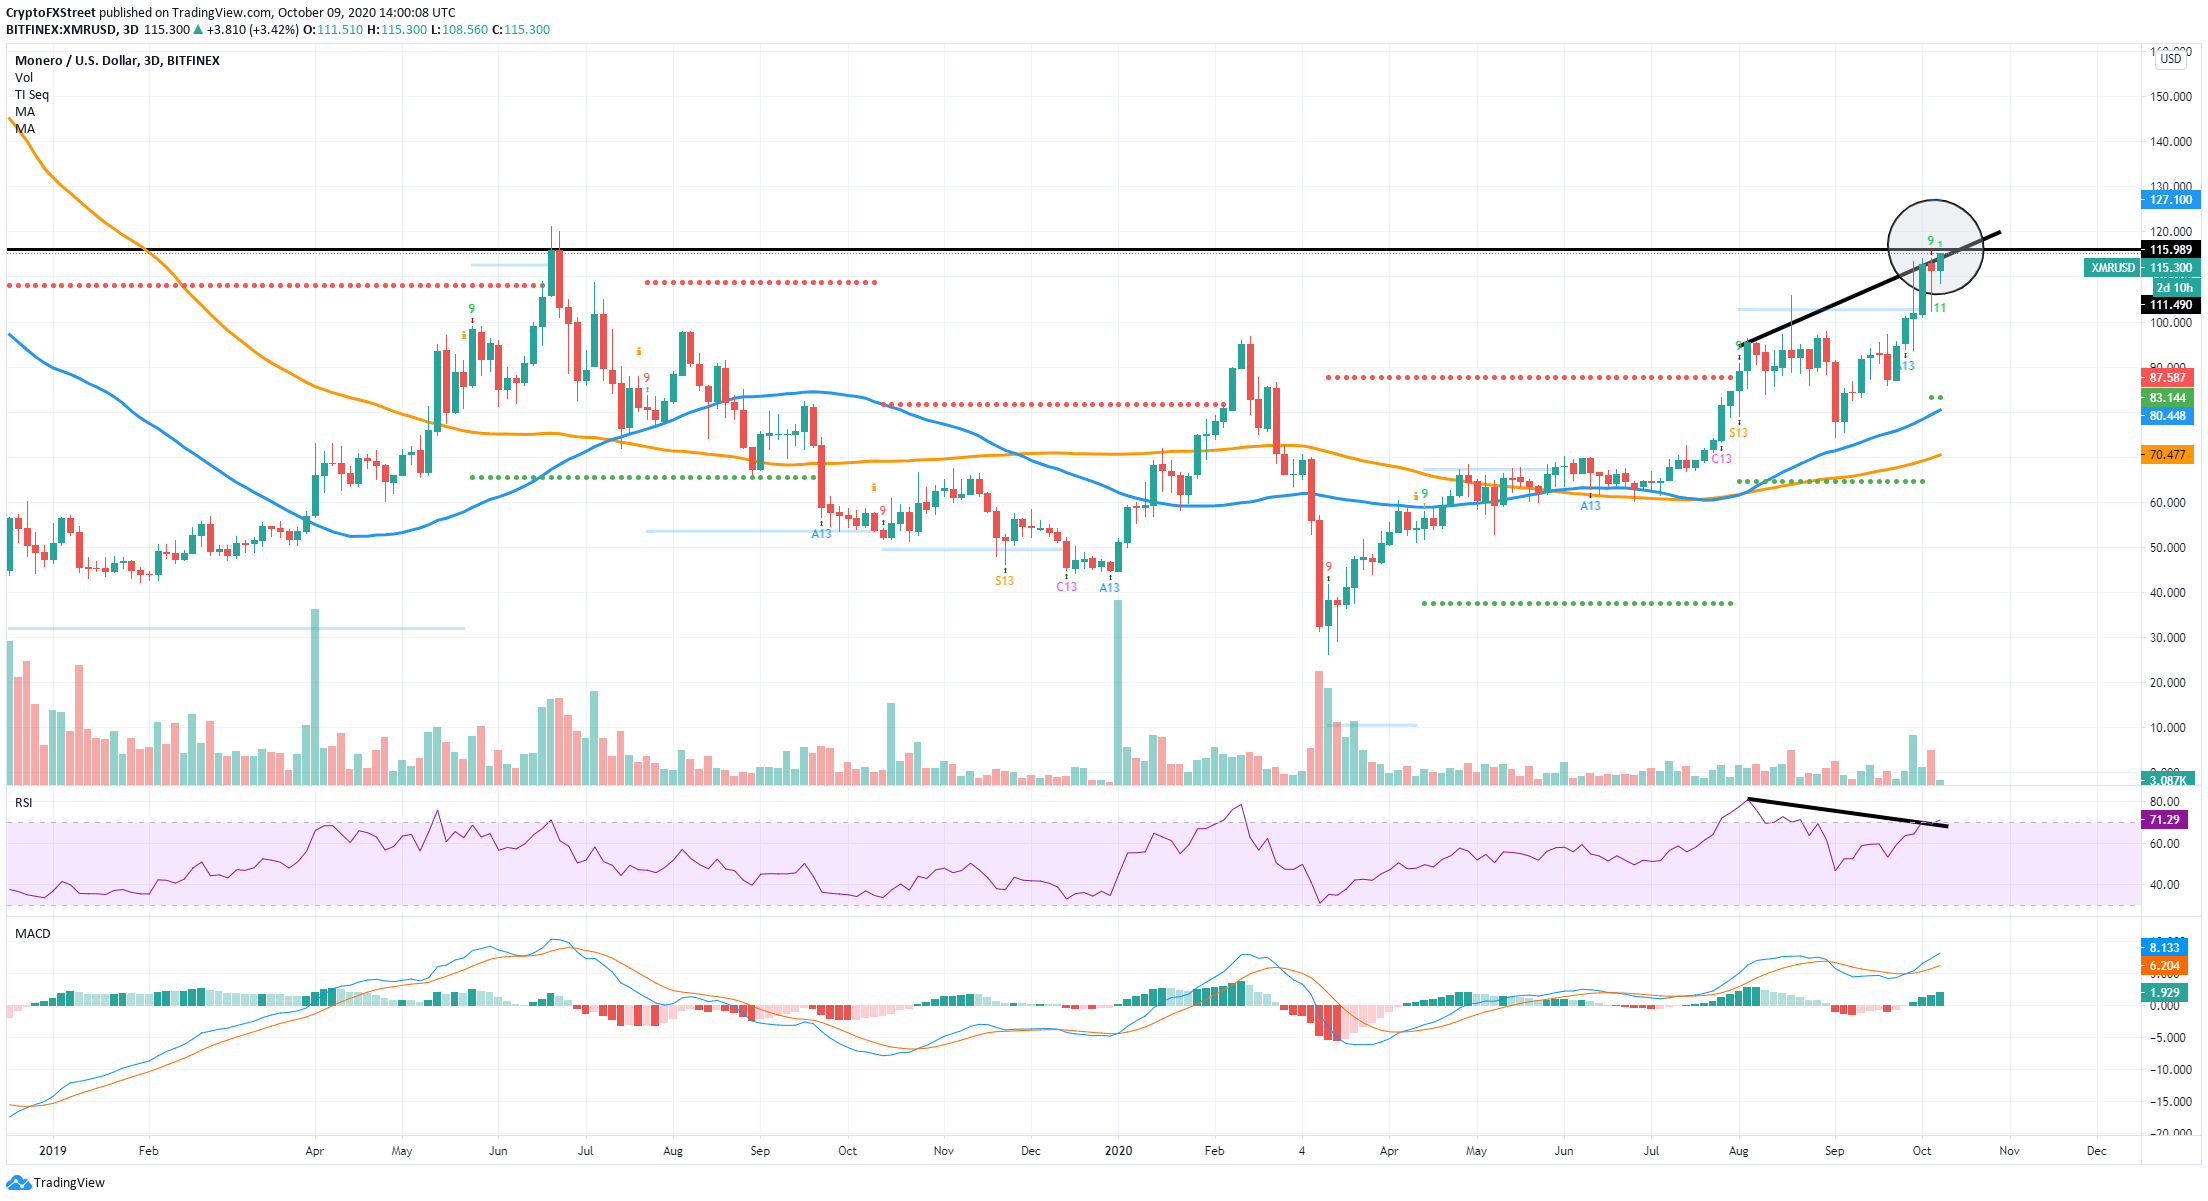
On the 3-day chart, the TD Sequential indicator presented a sell signal on October 6 and seemed to be topping out at $116, a resistance level established in June 2019. Additionally, the RSI and the price formed a notable bearish divergence.
The price has formed higher highs, but the RSI established lower highs, which creates a bearish divergence and indicates the trend is weakening.
XMR/USD 1-hour chart
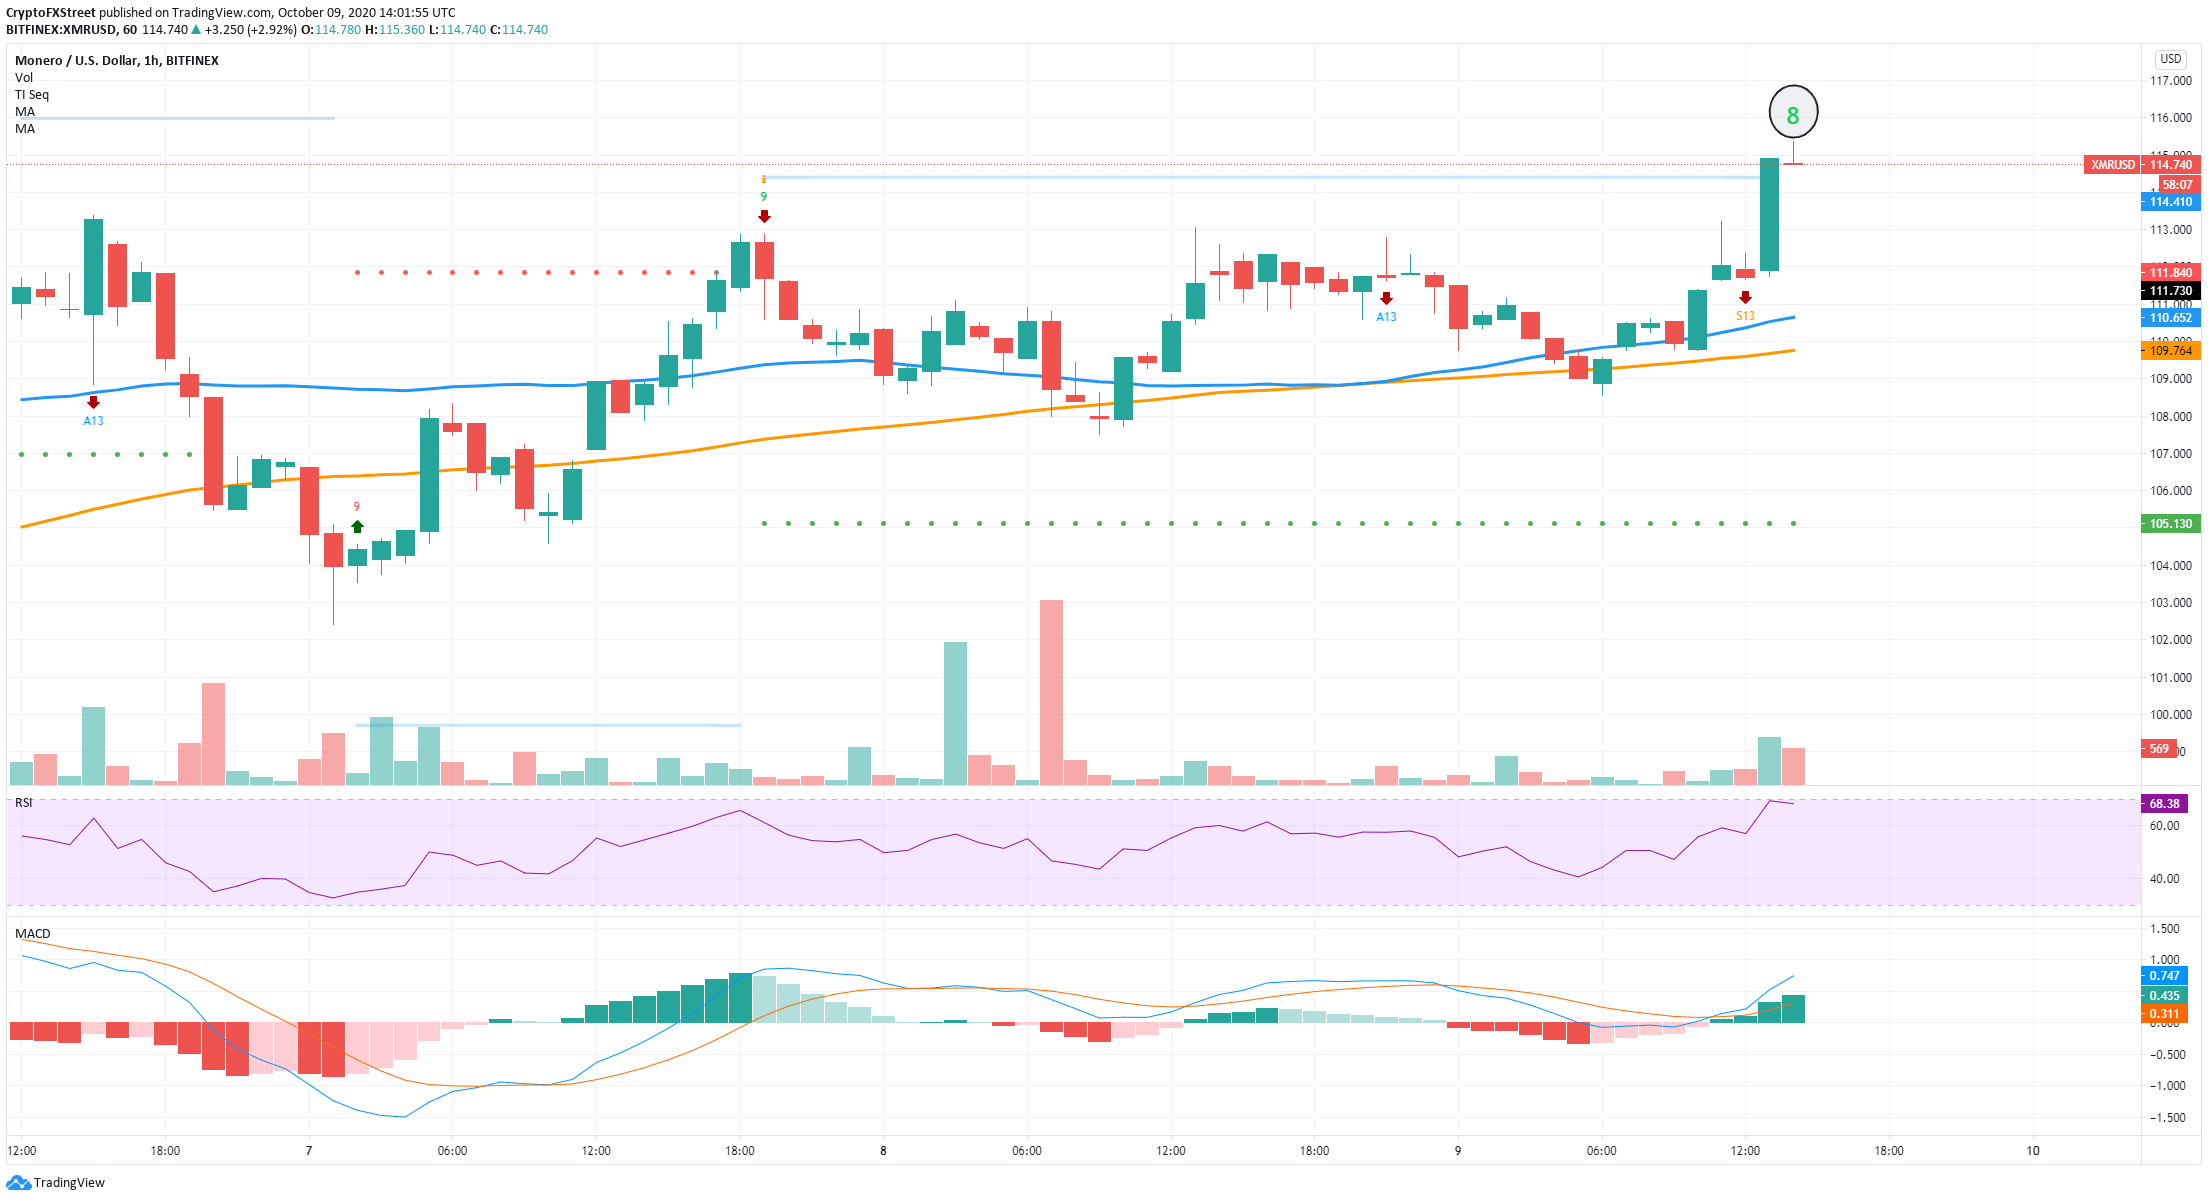
On the 1-hour chart, the TD sequential indicator has presented a green '8' signal, which usually precedes a sell signal. Validation of the 3-day sell signal and the hourly signal has the potential to drop XMR down to $96, an older resistance level on the 3-day chart.
A longer-term target price would be $80, where the 50-SMA is set on the 3-day chart, and $70, the 100-SMA.
Author

Lorenzo Stroe
Independent Analyst
Lorenzo is an experienced Technical Analyst and Content Writer who has been working in the cryptocurrency industry since 2012. He also has a passion for trading.


