Oil Forecast and News

High pump prices should give Tesla room to run. Harder borders should favor Ford's American plants. October delivered both, but neither carmaker walks away with a clean win.
Technical Analysis
In the daily chart, WTI US Oil trades at $96.11. The contract holds a bullish near-term bias as it extends above the 20-day Exponential Moving Average (EMA) at $92.29, suggesting buyers remain in control after the latest advance. Momentum reinforces this constructive tone, with the Relative Strength Index (14) hovering around 60, indicating firm but not yet overbought conditions.
On the downside, immediate support is seen at the 20-day EMA near $92.29, which underpins the current uptrend and would be the first line of defense on any pullback. As long as WTI holds above this moving average, the technical setup favors dip-buying rather than aggressive selling, with the current price around $96.11 acting as a near-term pivot for directional moves.
(The technical analysis of this story was written with the help of an AI tool. Know more.)
Fundamental Analysis
| Time | Event | Impact | Actual | Consensus | Previous |
|---|
At 16:14 GMT on October 15, Brent crude futures traded at $106.08 a barrel and WTI at $98.05, according to Reuters. For Tesla vs. Ford, the sharper question is where higher fuel bills become orders and where government action eats the benefit.
Tariff geography starts pricing the business
President Trump threatened to raise tariffs on Canadian vehicles and automotive parts. He said he would increase them to 50% from January 1, 2027. This adds uncertainty to production planning. The announced price rise is for 2027, but the prices we already pay for crossing the border are already high.
The U.S.-Canada tariff fight from August and China's recall campaign both sit inside that calculation. Reuters reported that Tesla and eight other manufacturers announced recalls covering roughly 4.3 million vehicles over emergency door-opening problems. Tesla's share came to 2.98 million units. The fixes included software updates, warning labels, and clearer handle markings.
The count of affected cars does not set the campaign's financial cost. It does show how a design tied to advanced technology can create regulatory duties across a huge installed base.
Tesla's Shanghai plant pairs Chinese demand with export output. That concentration can make manufacturing efficient, but it also leaves export economics tied to rules in the markets that receive those cars. The American and German factories give alternatives, though moving production means dealing with capacity, suppliers, and costs.
Ford's global network creates a different weak spot in North America. Local assembly may shield the company from imported rivals, while Canadian components still carry border risk. Final assembly location alone does not establish the vehicle's exposure to tariffs on imported components.
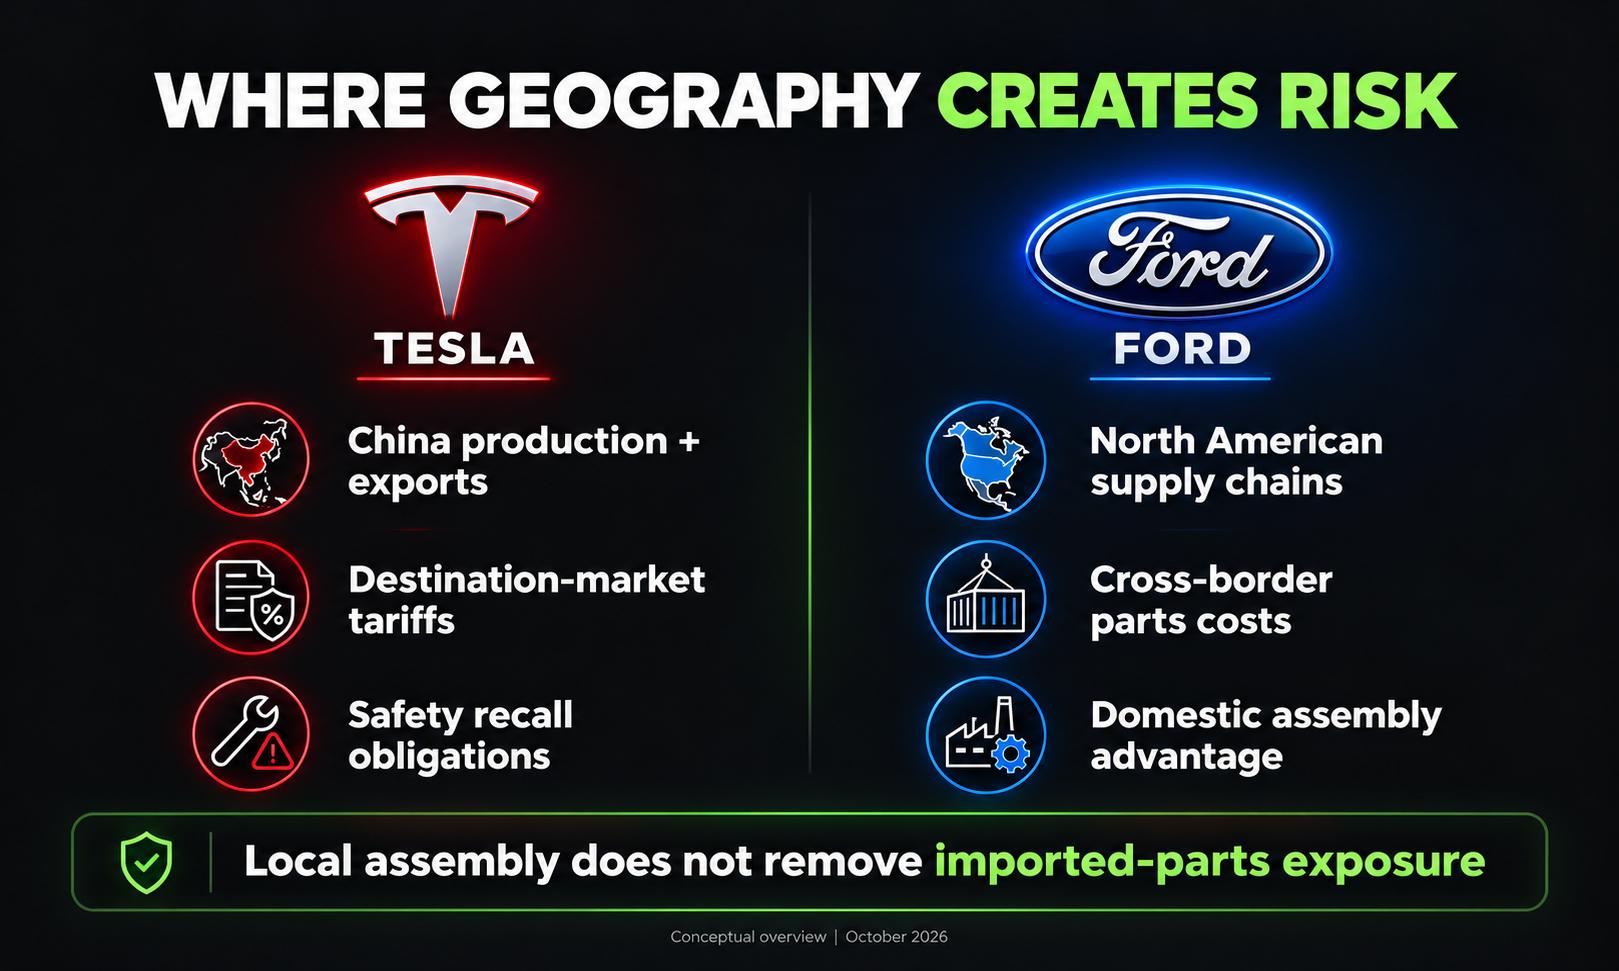
That adds difficulty to the familiar Tesla vs. Ford business model discussion. Technology still shapes costs and how buyers respond. Geography can determine how much of that edge survives the trip to the customer.
Expensive fuel produces different buyers
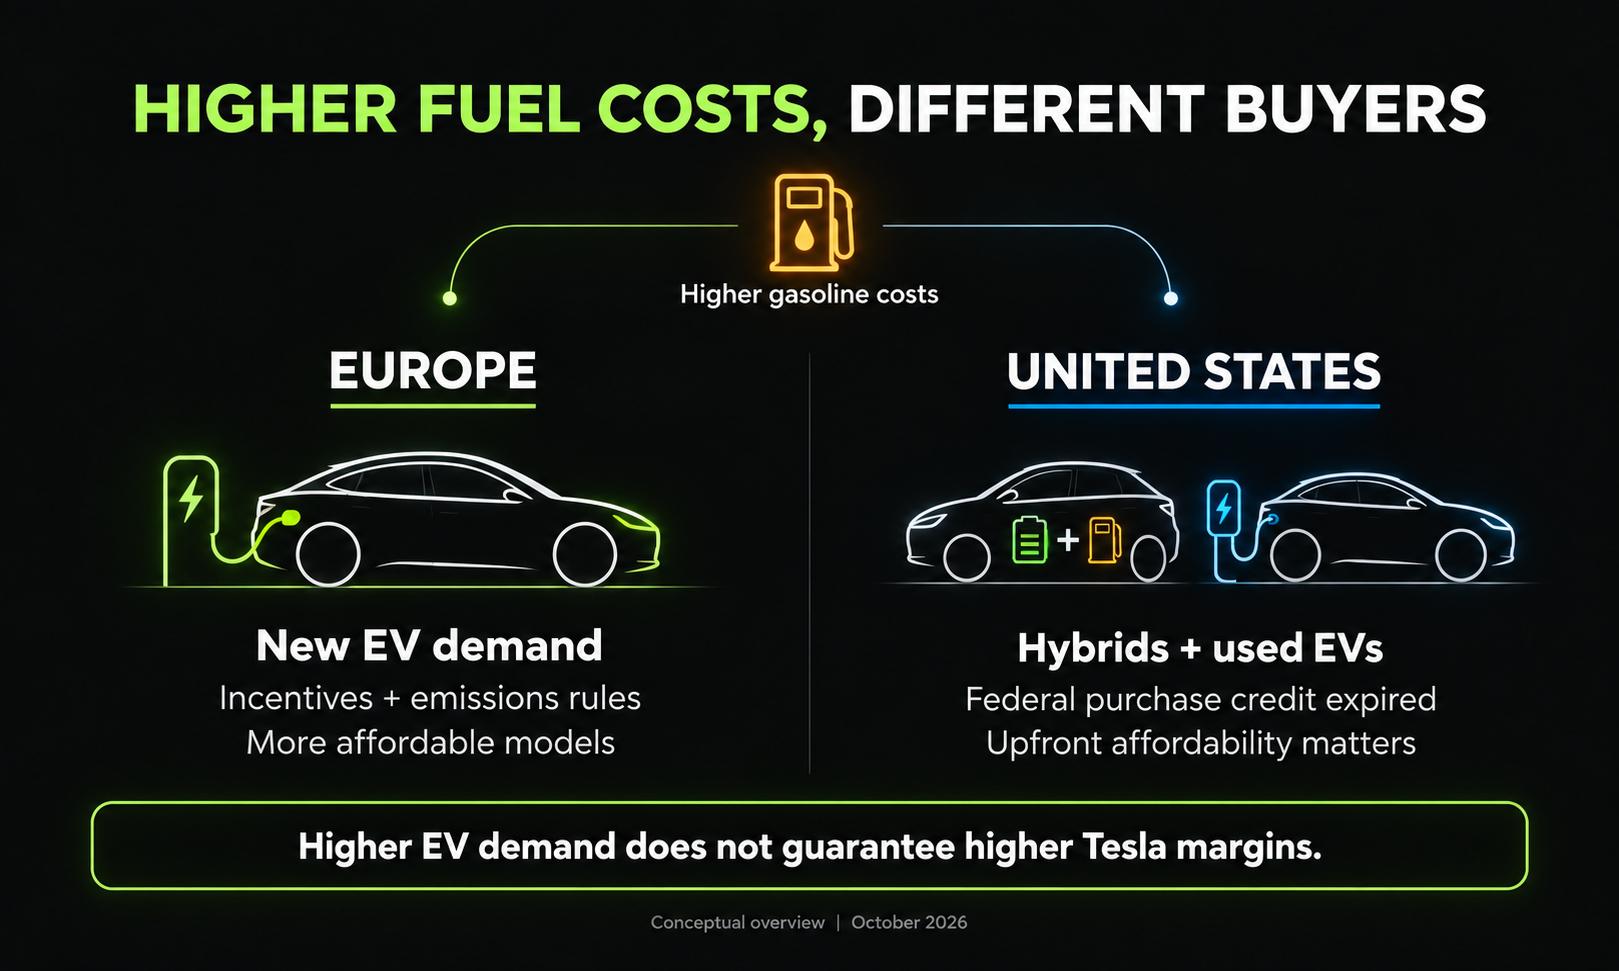
Demand is already uneven. On October 8, Reuters reported that EVs made up 23.2% of new car sales in Europe from January through September, up from 17.7% a year earlier. In the U.S., EV sales dropped 30.7% year over year in the same window, landing at 6% of new vehicle sales after the federal purchase credit lapsed.
European results also come from incentives, emissions laws, and a wider range of affordable models. American buyers shifted toward hybrids and used EVs. That split matters for Ford vs Tesla: money saved on fuel can flow to several vehicle types, including some that do not produce a new Tesla order.
A Tesla vs. Ford market share comparison, therefore, needs a specific region and a powertrain category. European EV growth does not establish the outlook for American showroom demand.
For Tesla, stronger EV demand could keep factories busier. Competitive pricing might still soak up some of that gain. For Ford, hybrid demand opens a door, while expensive fuel can make big combustion vehicles are harder to move without discounts. The result depends on the cars people pick.
TSLA/FORD comparison: What reaches shareholders
TSLA stock valuation stays hooked to expectations beyond current vehicle profit. A better Tesla shares forecast needs a believable route from demand to margins. A Tesla stock price forecast built only on expensive crude misses pricing pressure and regulatory costs.
The price of Ford shares depends partly on how much money is left after paying for tariffs, guarantees, and investments. The Ford stock dividend adds income to the Ford stock investment case, but payouts still depend on cash flow. A solid Ford stock forecast requires proof that shielding American production outweighs the disruption to its suppliers.
Ford stock performance and Tesla's returns can therefore move apart even when both manufacturers sell more cars.
This week's Versus Trade TSLA FORD analysis focuses on that gap. A choice to trade Tesla vs Ford can express a view about which company keeps more cash from the same political shock. Lower production costs lose some of their worth when the path to the buyer gets expensive.
About Oil
Crude oil, commonly known as petroleum, is a naturally occurring fossil fuel liquid composed of hydrocarbon underground deposits and organic materials. Its prices are typically measured in US Dollars (USD).
The top oil-producing countries include Saudi Arabia, Russia, the United States, Iran, and China, while the largest consumers are the United States, China, Japan, Russia, and Germany.
Crude oil is classified into various grades according to density (heavy versus light) and sulfur content (sour versus sweet). Lighter and sweeter crude commands higher prices because refiners can produce a greater yield of high-quality refined products from it.
Density is measured by API gravity, a scale developed to compare the density of petroleum to water. An API greater than 10 means the liquid floats on water. In general, crude Oils with API values between 40 and 45 degrees have the highest commercial value.
Sulfur content determines the quality of crude Oil. Crude with high sulfur content (sour crude) is less pure and sells cheaper compared to crude with low sulfur content (sweet crude).
Major benchmarks
There are two main benchmarks for pricing crude Oil: West Texas Intermediate (WTI) from the United States (US) and Brent from the United Kingdom (UK).
WTI Crude
WTI Oil is a type of Crude Oil sold on international markets. The WTI stands for West Texas Intermediate, one of three major types including Brent and Dubai Crude. WTI is also referred to as "light" and "sweet" because of its relatively low gravity and sulfur content respectively. It is considered a high-quality Oil that is easily refined. It is sourced in the United States and distributed via the Cushing hub, which is considered "The Pipeline Crossroads of the World".
Most WTI crude Oil is refined in the Midwest and the Gulf Coast regions of the US.
Supply and demand are the key drivers of WTI Oil price. As such, global growth can be a driver of increased demand and vice versa for weak global growth. Political instability, wars, and sanctions can disrupt supply and impact prices. The decisions of OPEC, a group of major Oil-producing countries, are another key driver of price. The value of the US Dollar influences the price of WTI Crude Oil since Oil is predominantly traded in US Dollars, thus a weaker US Dollar can make Oil more affordable and vice versa.
WTI serves as a benchmark in Oil pricing and is the underlying commodity of NYMEX Oil futures contracts.
Brent
Brent Crude Oil is a type of Crude Oil found in the North Sea that is used as a benchmark for international Oil prices. It is considered "light" and "sweet" because of its high gravity and low sulfur content, making it easier to refine into gasoline and other high-value products. Brent Crude Oil serves as a reference price for approximately two-thirds of the world's internationally traded Oil supplies. Its popularity rests on its availability and stability: the North Sea region has well-established infrastructure for Oil production and transportation, ensuring a reliable and consistent supply.
Brent crude is a blend from 15 different oil fields in the North Sea. It has an API gravity of 38.3 degrees and a sulfur content of around 0.37%, making it heavier and less sweet than WTI crude. Brent is suitable for the refinery of gasoline and middle distillates.
Originally traded on the International Petroleum Exchange in London, Brent crude futures have been listed on the Intercontinental Exchange (ICE) since 2005.
Oil and USD/CAD Correlation
The special relationship between Oil and the Loonie
Canada is among the world's largest Oil producers and it exports crude primarily to the US. This trade relationship directly impacts the Canadian Dollar (CAD), popularly known as the Loonie. Since Canadian dollars are needed to purchase and move Oil across the border, the fluctuation in Oil prices has a direct impact on the USD/CAD pair.
When Oil prices decline, the demand for the Loonie often weakens, causing USD/CAD to rise. Conversely, higher Oil prices frequently lead to CAD strength and a drop in the pair.
Oil prices are a significant factor influencing the Loonie's price action, alongside risk sentiment and economic fundamentals. If you are trading USD/CAD, monitoring Oil charts can provide crucial insights.