XAU/USD trims part of its daily losses, nears record highs

XAU/USD Current price: $3,842.66
- Political turmoil in the United States underpins the safe-haven Gold.
- Market participants are concerned about cancellations and delays in US data reporting.
- XAU/USD corrected near-term overbought conditions, aims for higher highs.
The XAU/USD pair recovers from an intraday low of $3,793.22 and approaches the record high posted during Asian trading hours at $3,871.76. The bright metal peaked early Tuesday amid headlines indicating United States (US) lawmakers were unable to agree on federal funding. As a result, the government will go into shutdown at midnight on Tuesday. The US Dollar (USD) found some near-term demand amid the dismal mood, but turned lower following the release of US data.
The Conference Board reported that the Consumer Confidence Index fell to 94.2 in September, down from a revised 97.8 in August, and below the 97.0 anticipated by market players. Additionally, the number of job openings on the last business day of August stood at 7.22 million, according to the US Bureau of Labor Statistics (BLS). The JOLTS Job Openings figure followed the 7.2 million openings reported for July and came in above the market expectation of 7.2 million.
Other than that, European Central Bank (ECB) President Christine Lagarde spoke at the Bank of Finland's International Monetary Policy Conference and noted that inflation risks remain quite contained, adding the central bank is well placed to respond if the risks to inflation shift or if new shocks emerge that threaten the ECB's target. Lagarde also repeated that the Eurozone economy is coping with US tariffs better than previously expected.
Market players are now waiting for headlines related to the US political turmoil. Should a shutdown occur, collecting and reporting data on federal offices may be delayed or suspended. As a result, the scheduled employment and inflation reports planned for the next few days may not be out, generating uncertainty and, hence, risk aversion.
XAU/USD short-term technical outlook
The daily chart for the XAU/USD pair shows it barely stands in the green, but keeps posting higher highs and higher lows, which skews the risk to the upside. The same chart shows the bright metal advanced further above a bullish 20 Simple Moving Average (SMA) currently at around $3,682. Meanwhile, the 100 and 200 SMAs picked up modest upward strength far below the shorter one, in line with the dominant bullish trend. Finally, the Relative Strength Index (RSI) indicator consolidates in extreme levels, at 89, while the Momentum indicator holds directionless well above its 100 line.
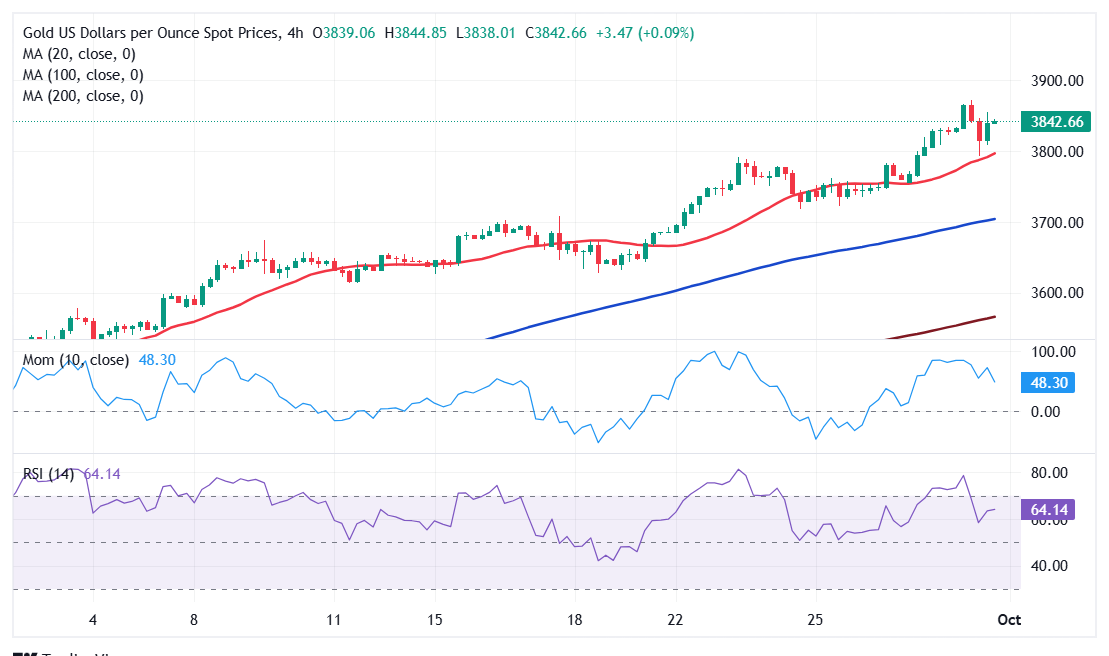
In the near term, and according to the 4-hour chart, XAU/USD corrected extreme overbought conditions and aims to resume its advance. Technical indicators turned sharply higher after easing from their recent peaks, aiming north well above their midlines. At the same time, buyers defended the downside at around a bullish 20 SMA, currently at $3,792, while the longer moving averages maintain their upward slopes below the shorter one. An extension towards $3,900 is on the table amid US political turmoil.
Support levels: 3,809.20 3,793.25 3,777.85
Resistance levels: 3,854.35 3,871.90 3,890.00
US Dollar Price Today
The table below shows the percentage change of US Dollar (USD) against listed major currencies today. US Dollar was the weakest against the Australian Dollar.
| USD | EUR | GBP | JPY | CAD | AUD | NZD | CHF | |
|---|---|---|---|---|---|---|---|---|
| USD | -0.10% | -0.10% | -0.50% | 0.13% | -0.55% | -0.35% | -0.25% | |
| EUR | 0.10% | -0.03% | -0.42% | 0.22% | -0.44% | -0.24% | -0.12% | |
| GBP | 0.10% | 0.03% | -0.38% | 0.27% | -0.44% | -0.22% | -0.09% | |
| JPY | 0.50% | 0.42% | 0.38% | 0.61% | -0.05% | 0.34% | 0.31% | |
| CAD | -0.13% | -0.22% | -0.27% | -0.61% | -0.68% | -0.45% | -0.36% | |
| AUD | 0.55% | 0.44% | 0.44% | 0.05% | 0.68% | 0.21% | 0.36% | |
| NZD | 0.35% | 0.24% | 0.22% | -0.34% | 0.45% | -0.21% | 0.13% | |
| CHF | 0.25% | 0.12% | 0.09% | -0.31% | 0.36% | -0.36% | -0.13% |
The heat map shows percentage changes of major currencies against each other. The base currency is picked from the left column, while the quote currency is picked from the top row. For example, if you pick the US Dollar from the left column and move along the horizontal line to the Japanese Yen, the percentage change displayed in the box will represent USD (base)/JPY (quote).
Premium
You have reached your limit of 3 free articles for this month.
Start your subscription and get access to all our original articles.
Author

Valeria Bednarik
FXStreet
Valeria Bednarik was born and lives in Buenos Aires, Argentina. Her passion for math and numbers pushed her into studying economics in her younger years.