Share:
  • The price of the precious metal surged almost 295 points after hitting rock bottom.

  • The Moving Average indicator maintains its bearish price signals.

  • The momentum oscillator, the Relative Strength Index, maintains its position within the natural zone and lacks impetus.

Gold reached a low level at 1.784.21 after breaking price limits that controlled the scene in the past few trading weeks. However, the yellow metal has risen back to the range after rebounding by around 295 pips from the rock bottom. At the time of writing, XAU/USD was trading at 1807.66, down 3.03 or (0.17%) on a daily basis. 

The precious metal has been in a frozen mood since June 17. As a result, gold has been trading in a narrow range where the price has been consolidating inside a tight sideways channel. On Friday, the XAU/USD broke the price limits, resulting in hitting the rock bottom of 1784.21, which was last seen in January of this year before it rebounded towards the previous price range.

This analysis relies on a 4-hour timeframe

XAUUSD

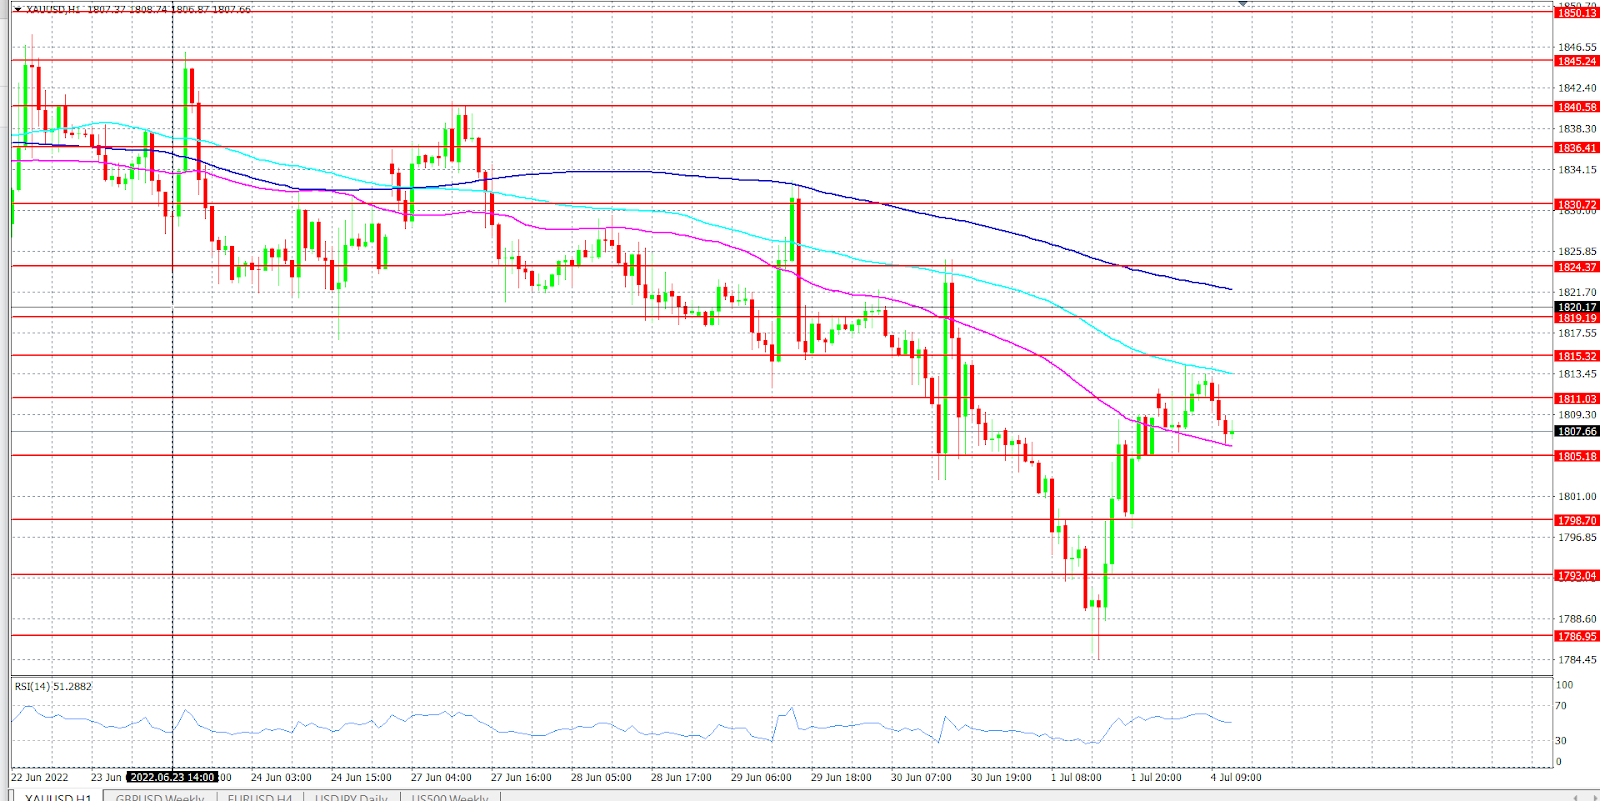
On the four-hour chart, the Moving Average indicator maintains its bearish price signal; the 100-periods slope crosses the 200-periods slope line as well as the 50-periods slope crosses below the 100-periods slope line, which indicates a bearish signal in the not far future. On the other hand, the momentum oscillator (RSI) lacks momentum. Records. 45.56 on the value line, which does not support price on following a market trend route in the current reading. 

However, the more likely scenario to occur is the bearish scenario. As a result, we will begin with the hurdle that could prevent the price from breaking the range again. The first hurdle on the downside will be the support level of 1805.18. If the price could breach the aforementioned level, that would pave the way towards 1798.70. A successful close below that level would bring 1793.70 to market participants' eyes, followed by Friday’s low at  1784.40. 

Alternatively, if the first hurdle on the downside at 1805.18 could prevent the price from falling below, that could push the price to retry conquering today's high at 1814.30. A successful break of today's high would open the door towards 1818.19, followed by the resistance level of 1830.72. If the price could breach the previously mentioned level, that may bring the price to hit the highest level recorded on Thursday at 1824.37.

Share: Feed news

Note: All information on this page is subject to change. The use of this website constitutes acceptance of our user agreement. Please read our privacy policy and legal disclaimer. Opinions expressed at FXstreet.com are those of the individual authors and do not necessarily represent the opinion of FXstreet.com or its management. Risk Disclosure: Trading foreign exchange on margin carries a high level of risk, and may not be suitable for all investors. The high degree of leverage can work against you as well as for you. Before deciding to invest in foreign exchange you should carefully consider your investment objectives, level of experience, and risk appetite. The possibility exists that you could sustain a loss of some or all of your initial investment and therefore you should not invest money that you cannot afford to lose. You should be aware of all the risks associated with foreign exchange trading, and seek advice from an independent financial advisor if you have any doubts.

Follow us on Telegram

Stay updated of all the news

Join Telegram

Recommended Content


Follow us on Telegram

Stay updated of all the news

Join Telegram

Recommended Content

Editors’ Picks

EUR/USD rebounds toward 1.0700 after EU inflation data

EUR/USD rebounds toward 1.0700 after EU inflation data

EUR/USD recovered toward 1.0700 despite soft inflation data from the Euro area, which revealed that the annual HICP rose 6.1% in May, compared to market expectation of 6.3%. The risk-positive market environment limits the USD's upside and helps the pair stretch higher ahead of key US data. 

EUR/USD News

GBP/USD eases below 1.2450 amid a steady US Dollar, ADP eyed

GBP/USD eases below 1.2450 amid a steady US Dollar, ADP eyed

GBP/USD is retreating from 1.2450 in the European morning, as the US Dollar looks to stabilize following the recent sell-off. Markets digest renewed dovish Fed expectations and US debt deal passage ahead of the top-tier US ADP jobs and ISM Manufacturing PMI data. 

GBP/USD News

Gold: $1,970, looming US employment clues prod XAU/USD bulls

Gold: $1,970, looming US employment clues prod XAU/USD bulls

Gold price teases bears after keeping the buyers hopeful in the last two days, retreating from the weekly top of late. In doing so, the yellow metal justifies the market’s dicey conditions.

Gold News

Bitcoin likely to remain in red through the next quarter if history is any indication

Bitcoin likely to remain in red through the next quarter if history is any indication

Bitcoin (BTC) price produced a monthly close at $27,210, noting a -6.92% return for May. The last-minute slide in BTC put an end to the four-month bullish streak that kickstarted the 2023 rally. 

Read more

US ADP Employment, ISM Manufacturing PMI Preview: First down, then up for US Dollar? Premium

US ADP Employment, ISM Manufacturing PMI Preview: First down, then up for US Dollar?

With or without the debt-ceiling crisis, the US Dollar is on the rise – but every trend has a countertrend, and a double-feature release creates opportunities. Ahead of Friday's Nonfarm Payrolls (NFP), Thursday's release of two critical leading indicators is set to rock markets.  

Read more

Majors

Cryptocurrencies

Signatures