XAU/USD forecast: Gold surges above $4,300 – Eyes locked on $4,500
- Gold holds firm above $4,300, with $4,500 now in sight as buyers dominate amid fiscal uncertainty.
- The U.S. shutdown and renewed rate-cut expectations are fueling safe-haven demand.
- Imbalances between $4,280–$4,362 signal unfilled bullish delivery - momentum favors another leg higher while these zones remain intact.

Gold extends its record-breaking run

Gold continues to defy gravity. Prices surged beyond $4,300, printing a fresh all-time high at $4,400, and remain elevated as traders weigh a U.S. government shutdown against the prospect of deeper Federal Reserve rate cuts.
This rally isn’t just sentiment-driven - it’s underpinned by real shifts in macro positioning. The longer the U.S. stays in fiscal limbo, the stronger the bid for havens like gold becomes. Treasury yields are easing, the dollar is softening, and global fund flows are rotating back into metals.
At the same time, institutional forecasts are rising. Several banks, including HSBC, now envision scenarios reaching $4,700–$5,000/oz by 2026. This bullish conviction is showing up in price structure itself - higher lows, expanding imbalances, and repeated demand rejections that reveal ongoing accumulation.
“Every dip is being bought; every pause becomes a platform,” one analyst noted.
Gold’s behavior mirrors that - shallow pullbacks, aggressive reclaims, and clean Fair Value Gaps tell the story.
Fundamental backdrop: Shutdown, yields and risk appetite
- U.S. Government Shutdown: The prolonged stalemate has delayed key data (like CPI and NFP), forcing traders to operate in an informational vacuum. Historically, such uncertainty boosts safe-haven flows - and gold is capitalizing on it.
- Fed Rate-Cut Bets: Markets are pricing in further easing later this year, pulling real yields lower. Each hint of dovish commentary adds fuel to the metal’s bid.
- Geopolitical Risk: From Middle-East flareups to U.S.–China tariff tension, geopolitical uncertainty continues to support defensive allocations.
- Institutional Support: Central banks remain consistent buyers. Their steady accumulation provides a long-term anchor under prices.
Together, these drivers reinforce one message: the gold bull cycle is not done.
Technical outlook: Gold poised for $4,500?
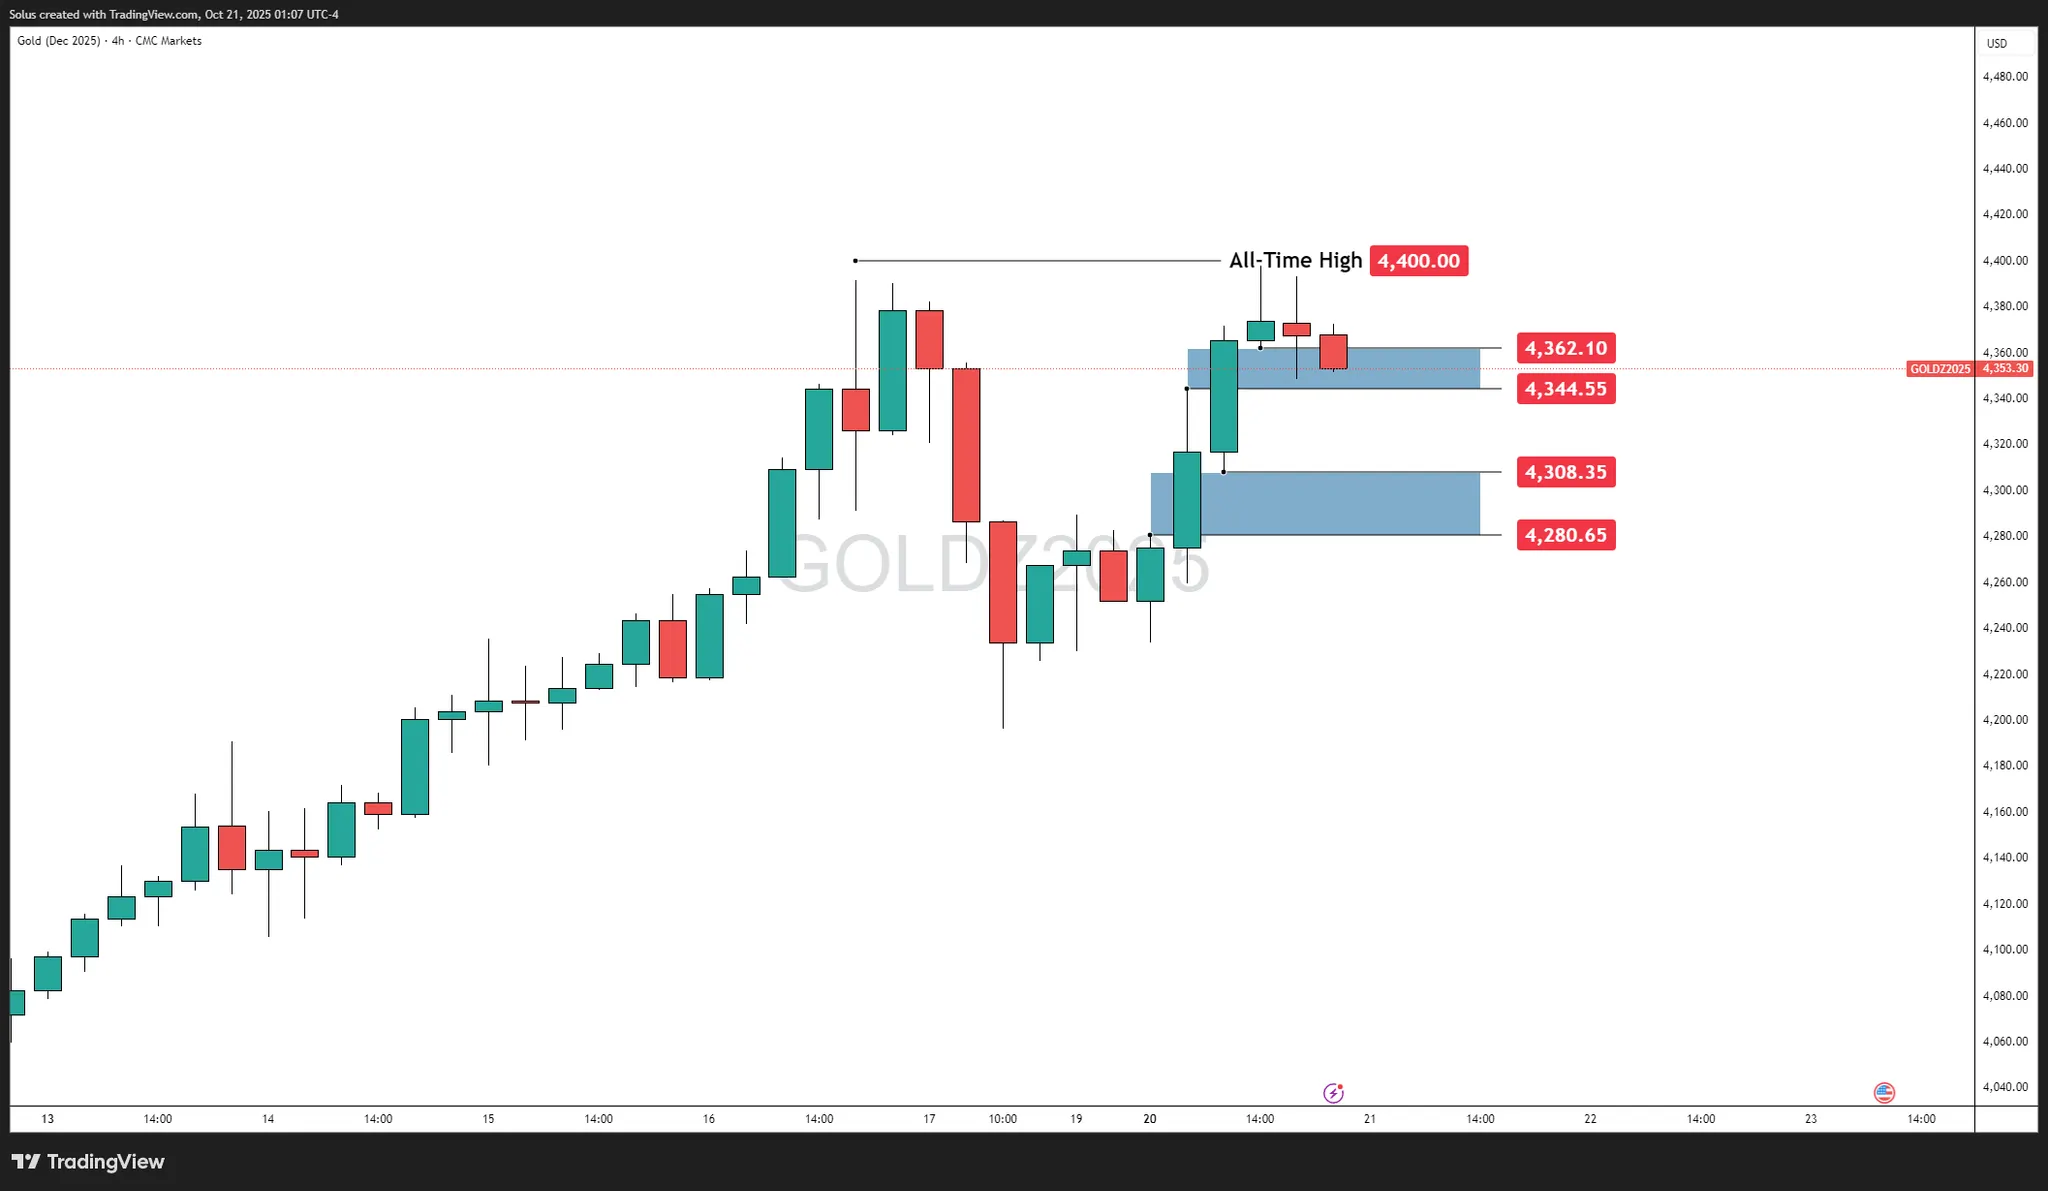
Gold’s 4H structure remains clean and bullish. After printing the $4,400 all-time high, price has pulled back modestly into a tight $4,340–$4,360 consolidation zone, resting just above two well-defined Fair Value Gaps (FVGs).
Key levels
- All-Time High: $4,400.00.
- Upper FVG (Intraday Demand): $4,344.55 – $4,362.10.
- Lower FVG (Structural Demand): $4,280.65 – $4,308.35.
These volume-weighted imbalances are telling a consistent story: buyers remain in control of delivery. Each time gold retraces into these zones, aggressive bidding emerges - proof of institutional absorption and bullish imbalance continuity.
Bullish scenario – Reaccumulation for $4,500 expansion
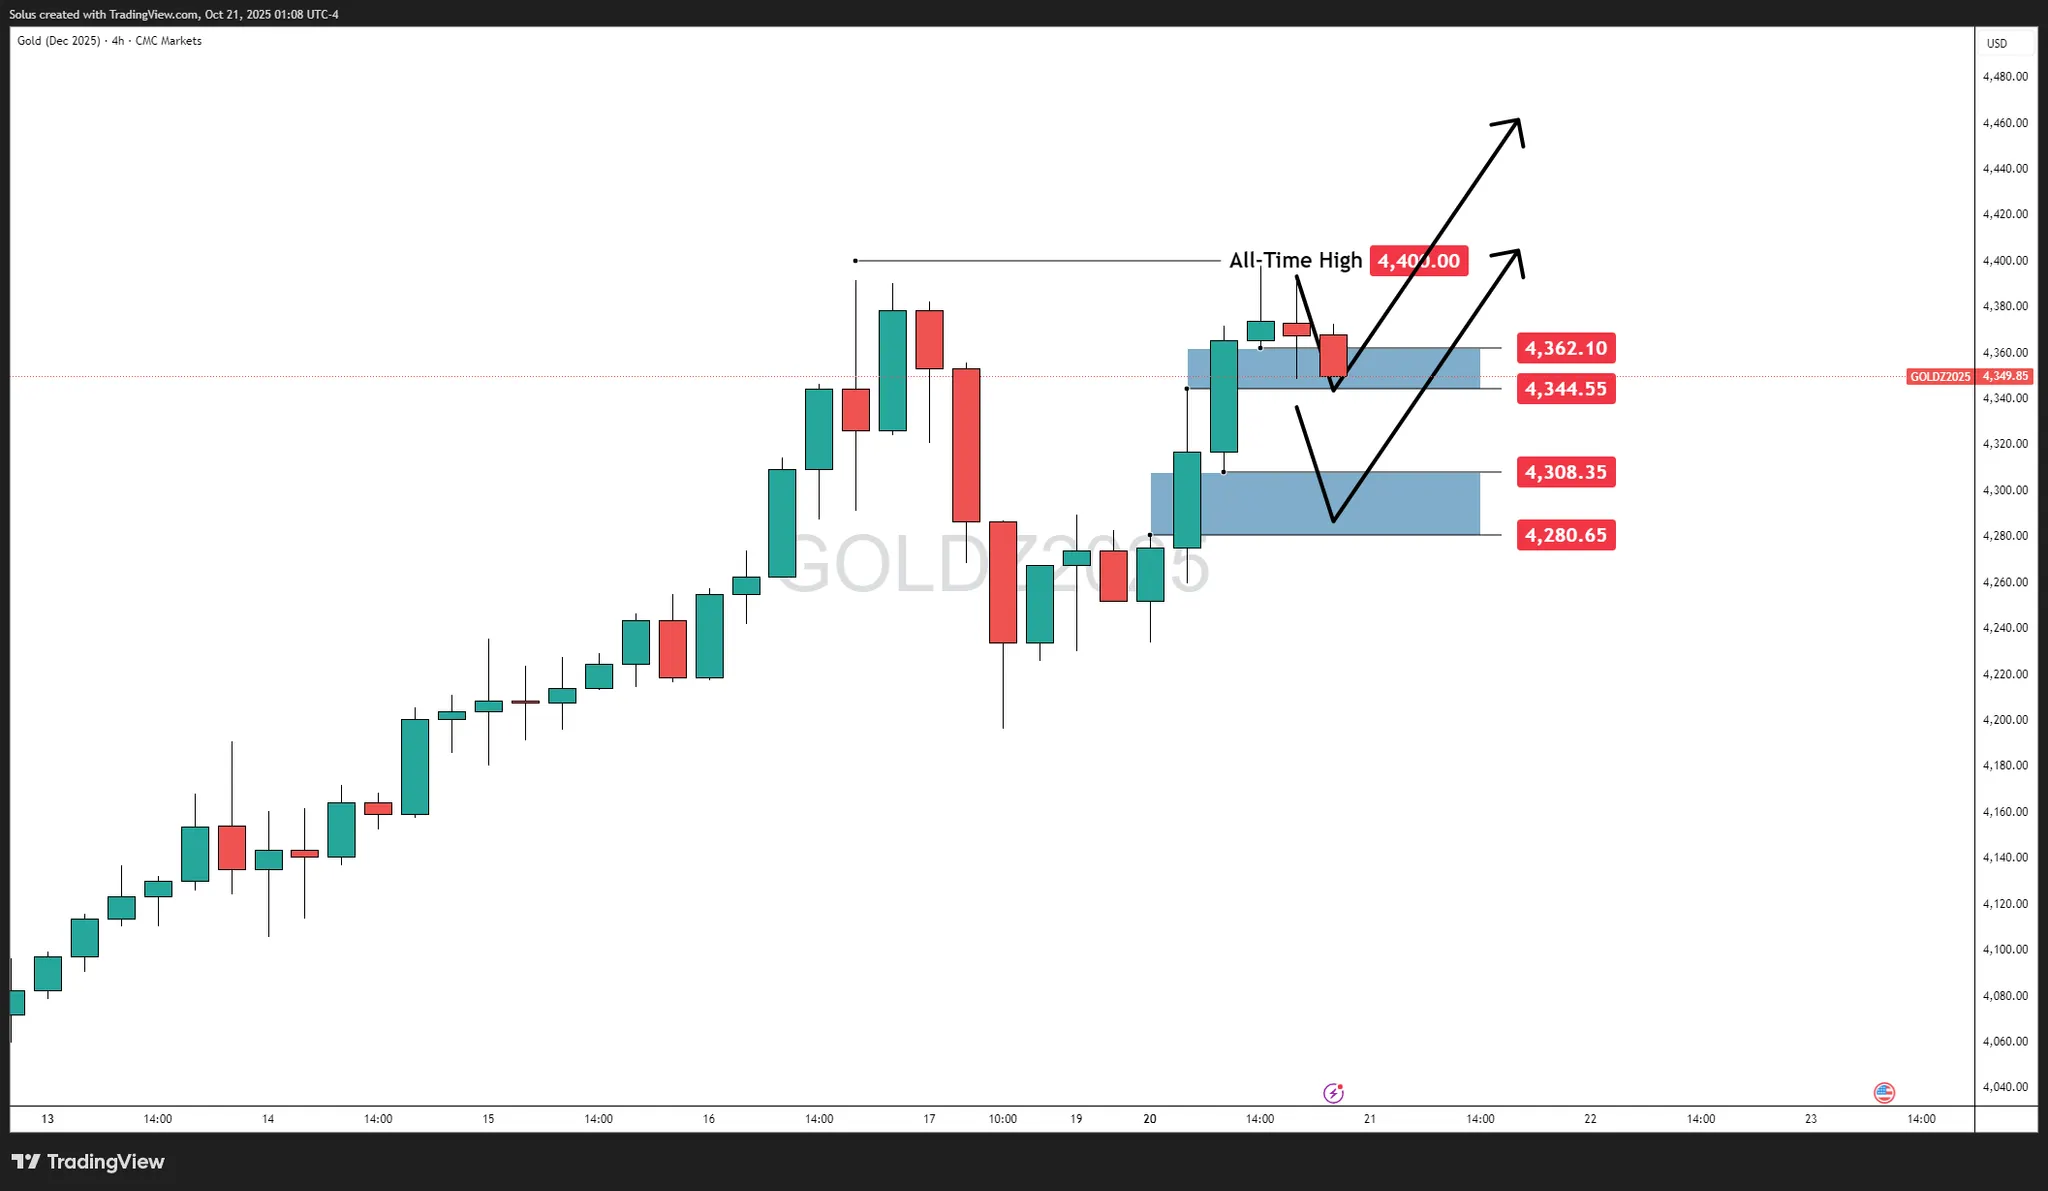
Price consolidates above the upper FVG ($4,344–$4,362) while respecting the $4,308 demand base. The structure shows higher lows and a compression pattern under resistance - classic signs of reaccumulation before expansion.
Trigger:
A decisive close above $4,380–$4,400 confirms a liquidity sweep and continuation phase.
Targets:
- $4,450 – minor liquidity magnet.
- $4,480–$4,500 – projected measured move/next extension.
The current imbalances act as launchpads, not exhaustion points. Volume profiles reveal sustained buy-side inefficiency - meaning supply hasn’t caught up. As long as $4,344 holds, gold remains in bullish delivery targeting $4,500.
Bearish scenario – Short-term repricing before continuation
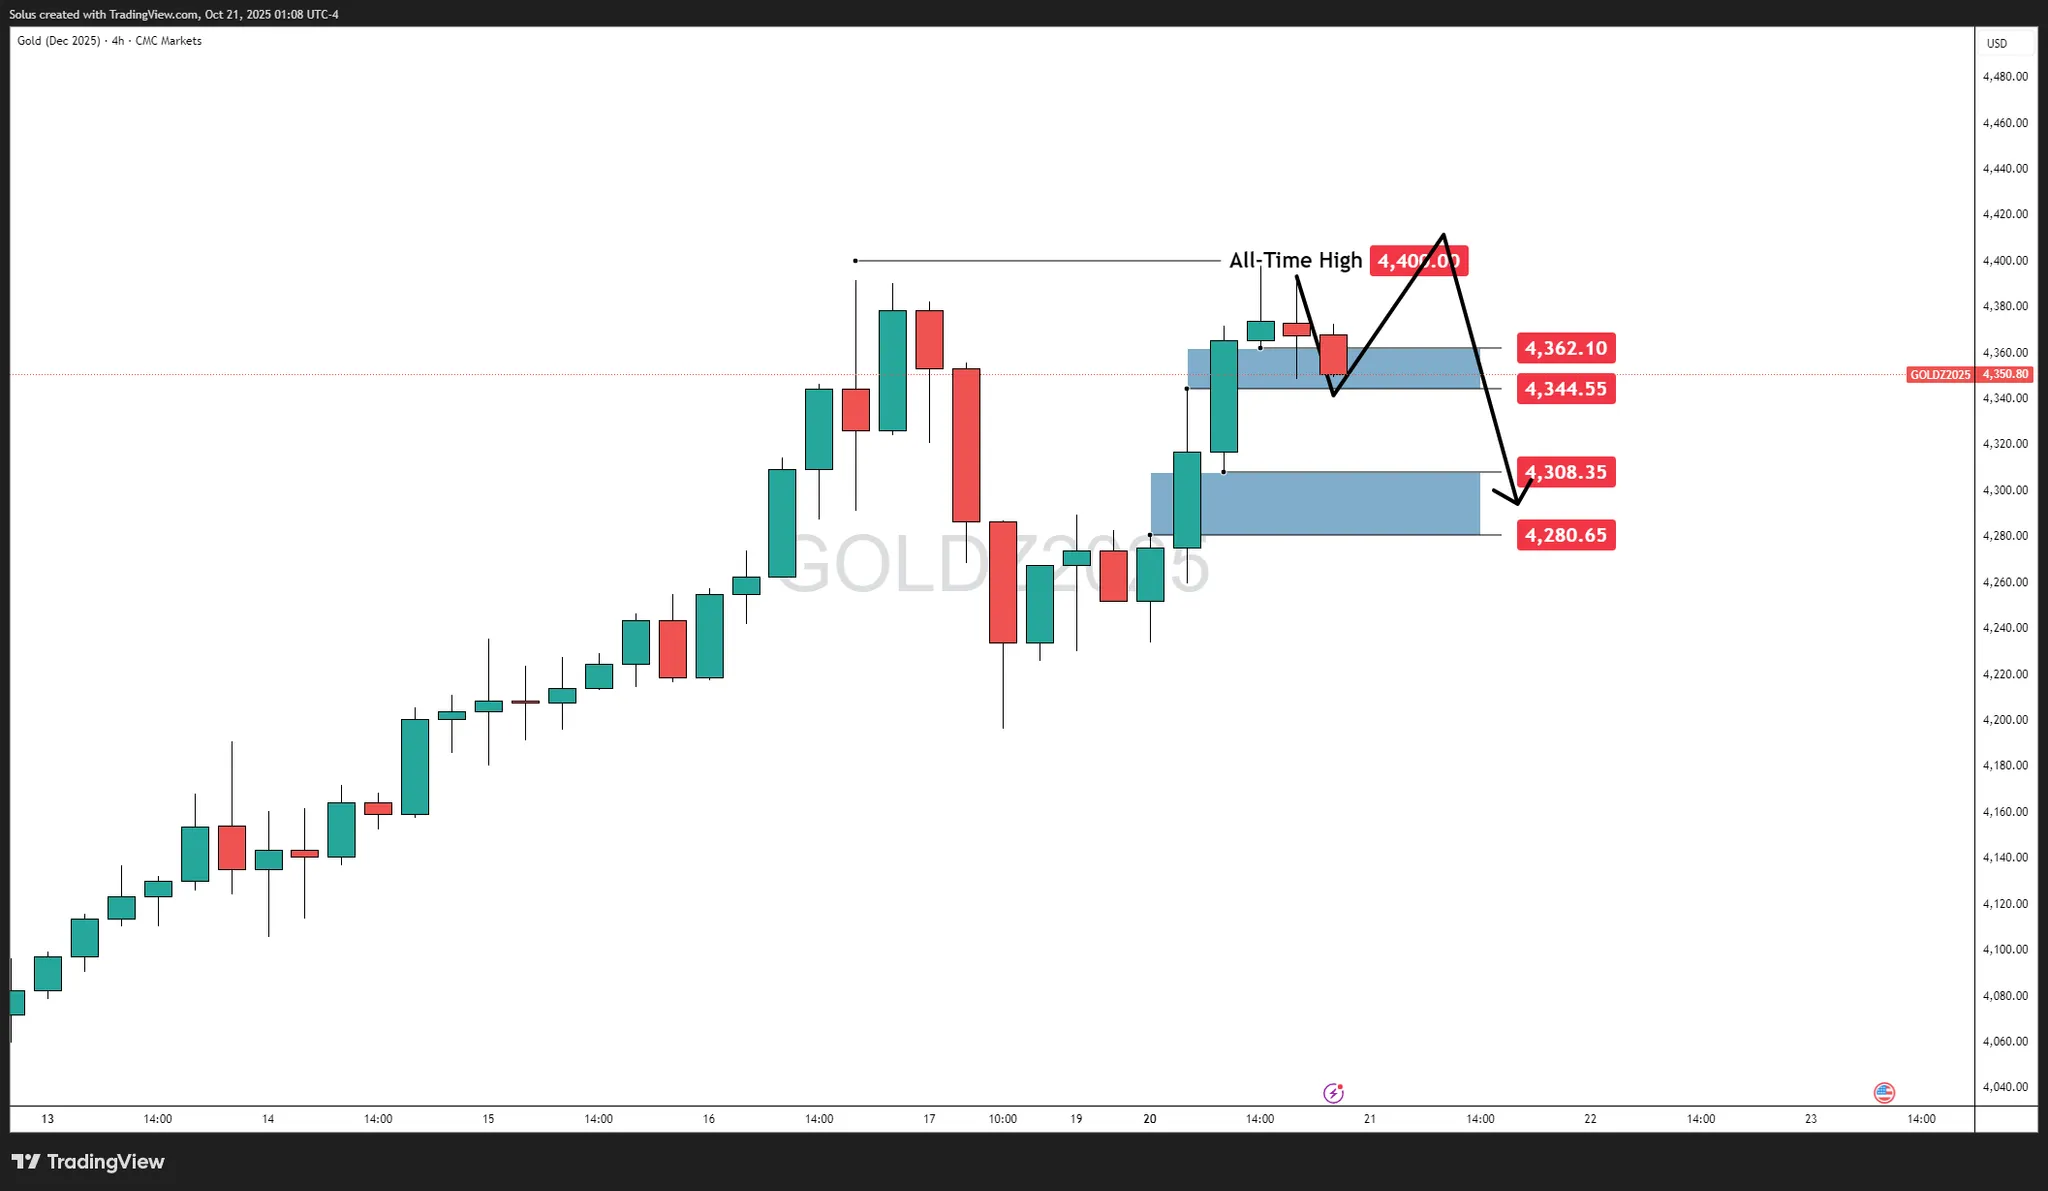
If gold fails to defend the upper imbalance ($4,344–$4,362), the market could engineer a deeper pullback into the lower FVG ($4,280–$4,308) for liquidity mitigation.
Trigger:
A clean close below $4,344 signals a short-term correction toward the lower zone.
Targets:
- $4,308 – mid-demand retest.
- $4,280 – structural FVG fill and liquidity sweep.
Continuation Risk:
Only a decisive breakdown below $4,280 would suggest a deeper retracement to $4,240–$4,210. Otherwise, this scenario represents a liquidity grab and reload opportunity for bullish continuation back toward $4,500.
Final takeaway
Gold’s current structure is not showing exhaustion; it’s showing controlled aggression.
The story told by the charts - through price gaps, imbalances, and failed breakdowns - is one of institutional continuation.
As long as price holds above $4,280–$4,300, every pullback remains an opportunity within the broader bullish delivery cycle.
The next big psychological magnet sits at $4,500 - and unless macro sentiment shifts dramatically, the path there looks more like a question of “when,” not “if.”
Author

Jasper Osita
Independent Analyst
Jasper has been in the markets since 2019 trading currencies, indices and commodities like Gold. His approach in the market is heavily accompanied by technical analysis, trading Smart Money Concepts (SMC) with fundamentals in mind.