XAG/USD forecast: Silver gears for breakout – Is Silver the next Gold?
- Silver consolidates near $51, preparing for a breakout as the market digests a 4-hour volume imbalance ($51.118–$52.395).
- The metal remains supported by strong industrial demand, tight supply, and safe-haven inflows similar to gold’s earlier rally.
- A 4H close above $52.395 could send silver toward $54–$55, while failure below $50.60 risks a dip into $49.66 before re-accumulation.

Silver gathers Momentum beneath $54 – Following Gold’s footsteps
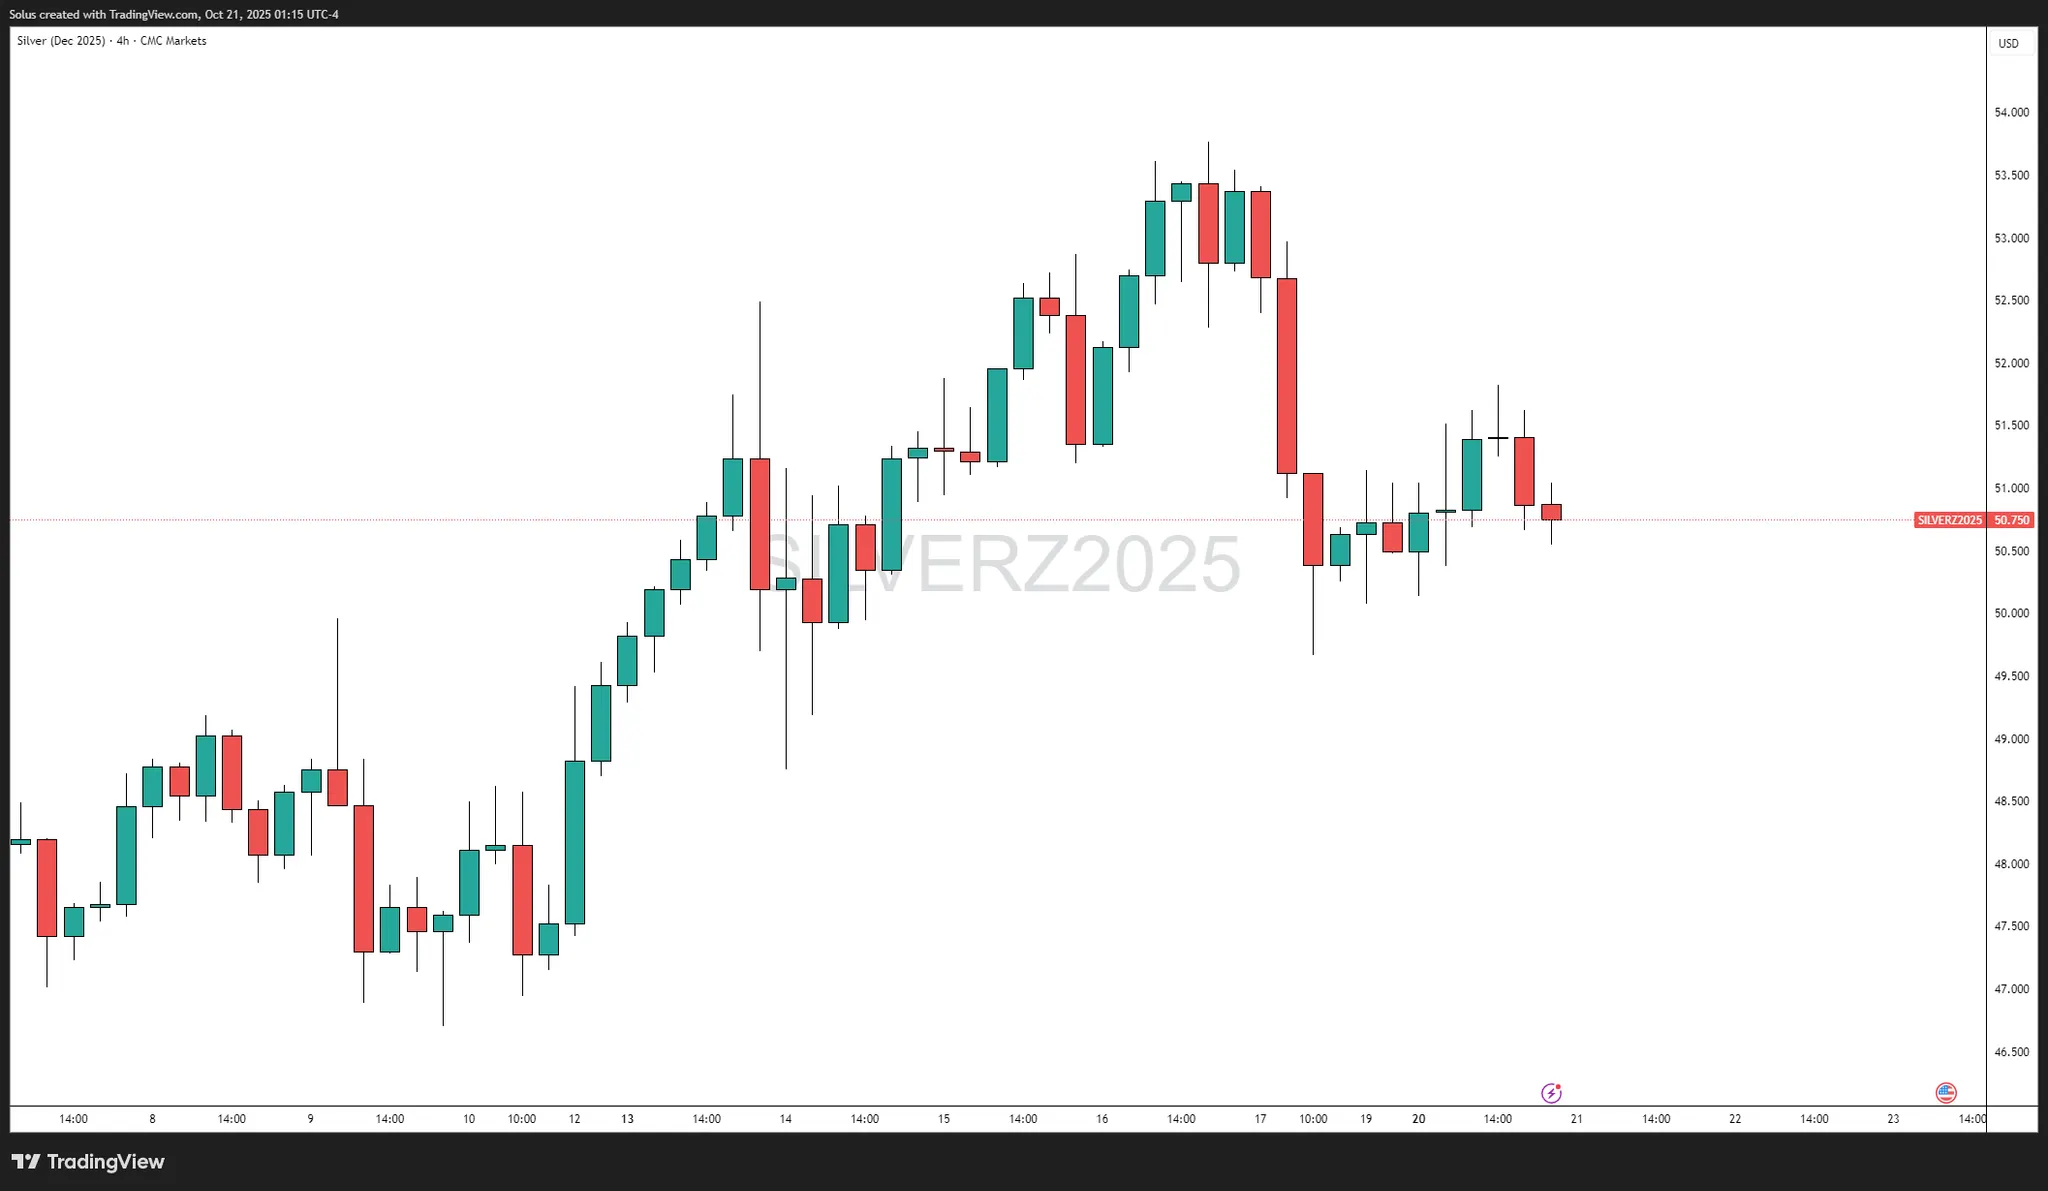
Silver has entered a tension-filled holding pattern — not weak, just waiting for ignition.
After rallying to $54/oz, its highest in more than a decade, the market is now consolidating just below that level, mirroring gold’s earlier pattern before its own explosive breakout.
The reason? The metal is balancing order flow inside a critical 4-hour Fair Value Gap (FVG) between $51.118–$52.395 — a zone where prior selling created inefficiency.
Price currently sits at $50.75, testing buyers’ commitment as volume compresses and liquidity builds.
This “pause before propulsion” could define silver’s next major phase — and traders are watching whether it repeats gold’s parabolic move.
Silver mirrors Gold’s macro tailwinds
Industrial demand still rising:
Silver’s dual role — industrial metal and monetary hedge — keeps it in demand. The solar and EV sectors continue to consume record levels of silver, straining mine output in Mexico, Peru, and China.
Physical shortage deepens:
Physical silver inventories at London and COMEX remain near multi-year lows, forcing refiners to reroute supply from Asia. This supply squeeze underpins the spot premium and keeps futures backwardated.
Safe-haven flows pick up:
With the U.S. shutdown dragging on and investors bracing for further Fed cuts, funds are once again rotating into metals. As gold flirts with $4,500, silver is attracting renewed speculative inflows aiming to catch “the next gold-style breakout.”
Technical outlook: Silver mirroring Gold?
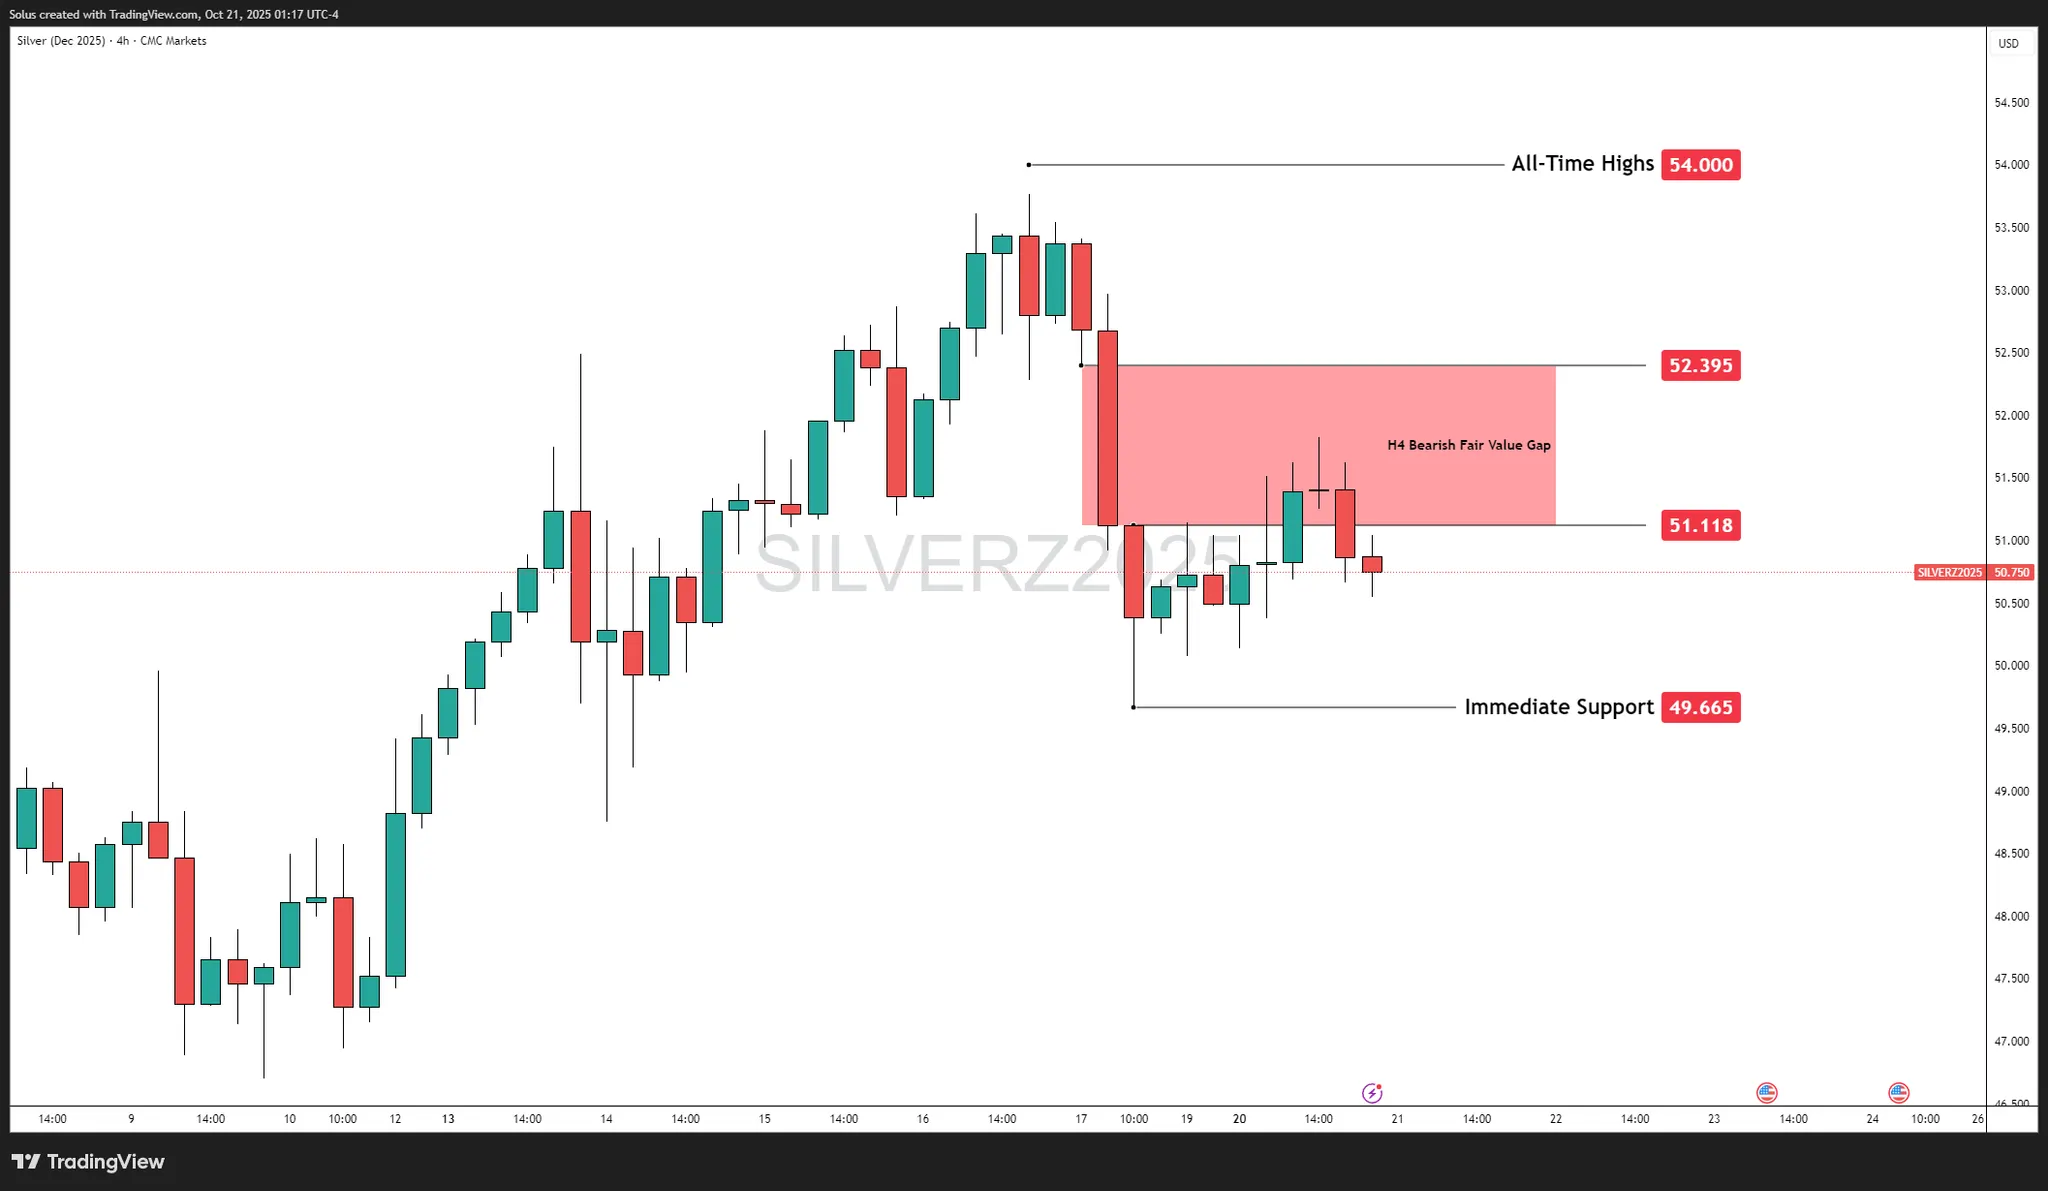
Silver’s structure remains constructively bullish, though tactically neutral within the current balance.
The 4-hour volume imbalance ($51.118–$52.395) acts as the pivot — a zone where supply met demand but delivery remains unfinished.
Price is compressing between this imbalance and immediate support at $49.665.
When that compression breaks, momentum should accelerate sharply.
Key technical levels
|
Type |
Price Zone |
Technical Role |
|---|---|---|
|
All-Time High |
$54.000 |
Liquidity target |
|
H4 Volume Imbalance (FVG) |
$51.118 – $52.395 |
Control zone / re-pricing area |
|
Immediate Support |
$49.665 |
Short-term liquidity base |
|
Bullish Targets |
$53 → $54 → $55 |
Expansion levels |
|
Bearish Targets |
$49.00 → $47.80 |
Re-pricing zones |
Bullish scenario – Reclaiming the 4H volume imbalance

Silver’s repeated defense of $50–$50.70 shows buy-side absorption.
If price reclaims $51.118, it signals demand stepping back into imbalance territory.
Trigger:
A 4H close above $51.118 followed by a break through $52.395 confirms that sellers’ inefficiency has been filled and flipped to support.
Targets:
- $53.00 – first liquidity magnet
- $54.00–$55.00 – next expansion wave
Narrative:
This would mark a bullish re-balancing of volume, restoring buy-side delivery similar to gold’s prior structure.
A successful FVG reclaim transforms the zone into demand — often the prelude to a sustained breakout.
Bearish scenario – Rejection from the volume imbalance
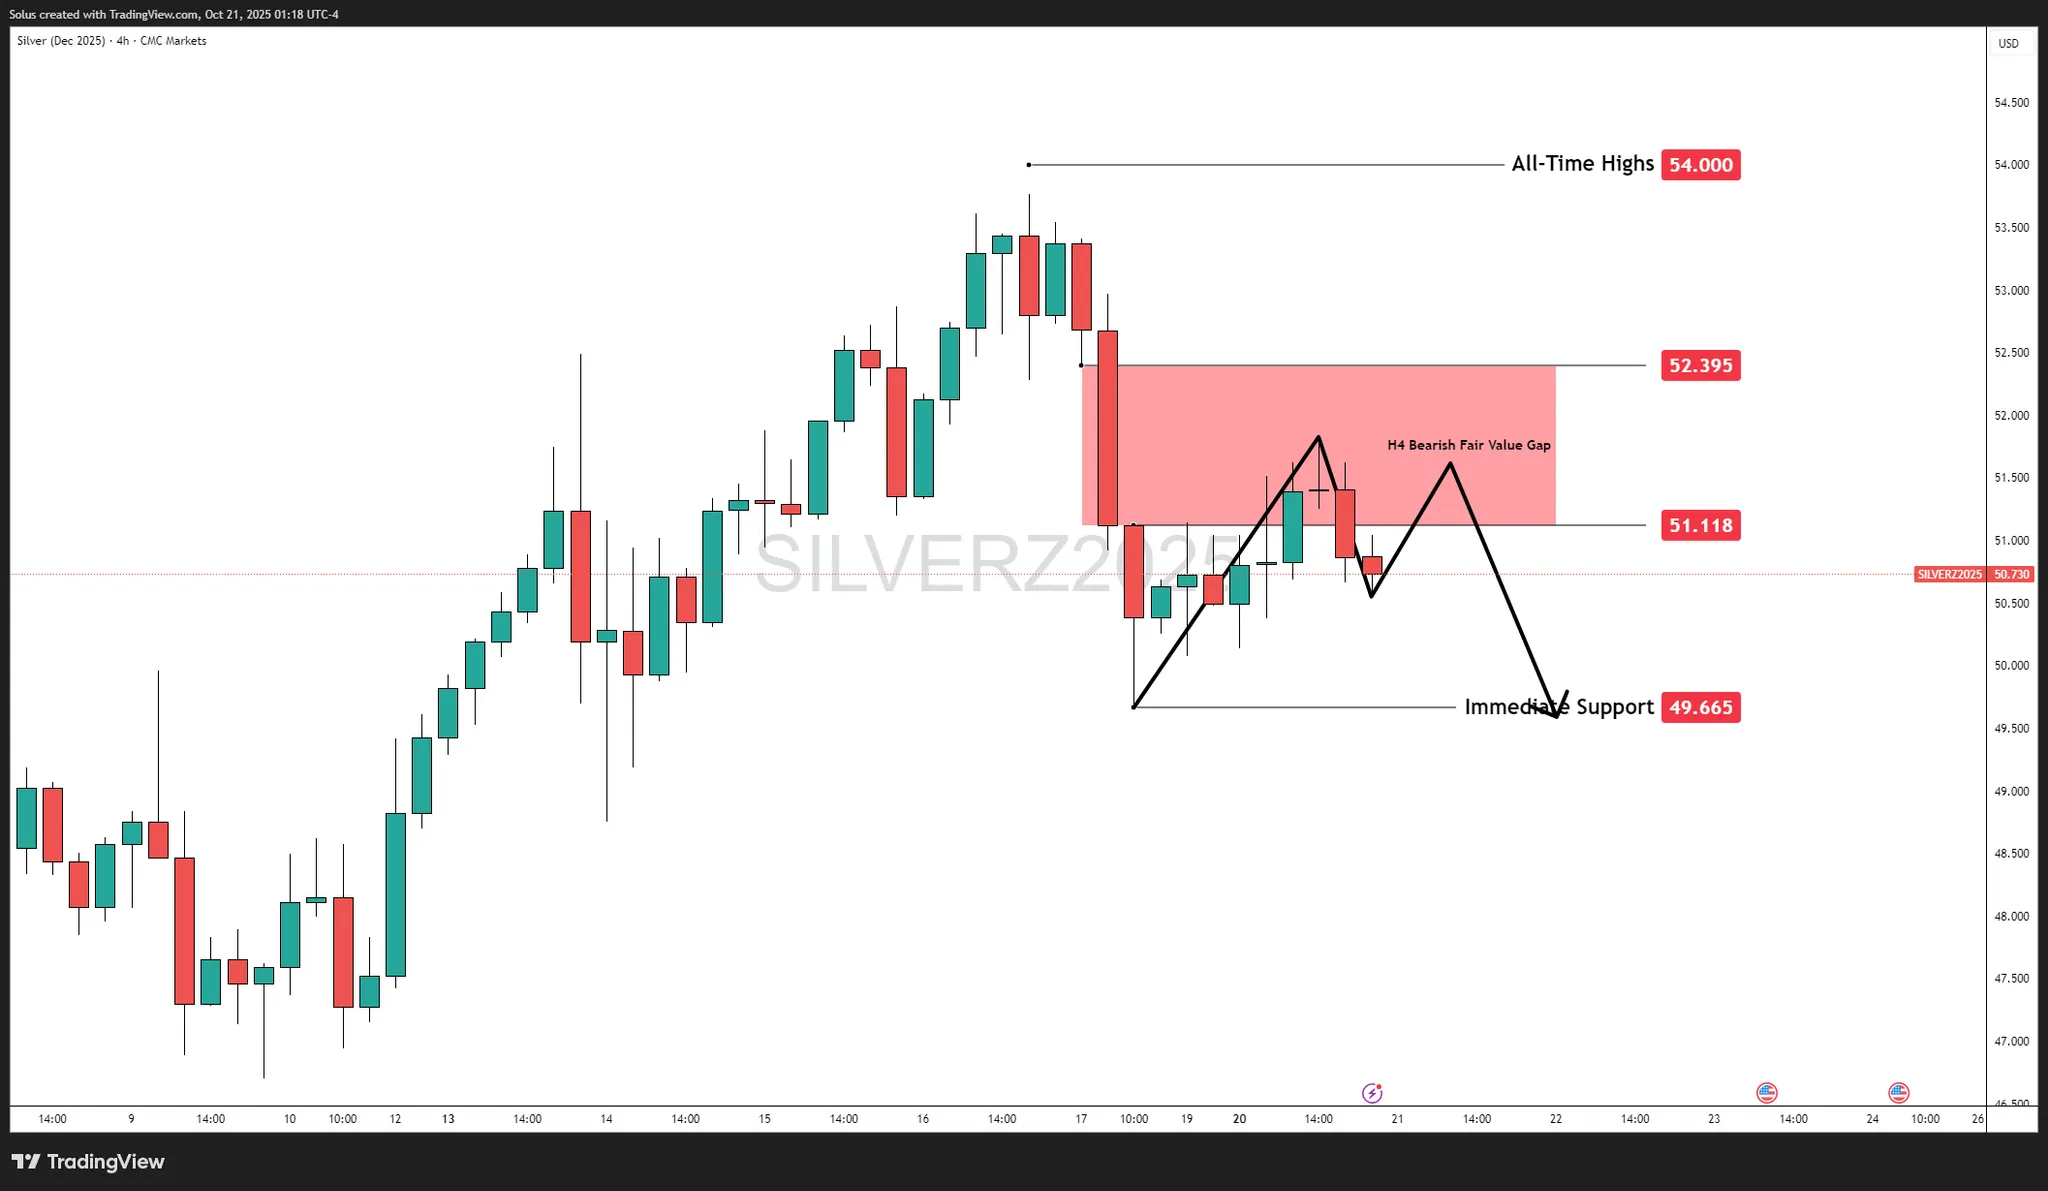
Failure to close above $52.395 or repeated rejections inside the FVG suggest sellers are still defending overhead liquidity.
Trigger:
A 4H close below $50.60 signals renewed sell-side control and continuation toward liquidity resting below $49.60.
Targets:
- $49.665 – immediate liquidity draw
- $48.50 → $47.80 – deeper discount territory
Narrative:
As long as $51.118 remains unclaimed, the imbalance stays bearish.
Price could slide into discount levels before rebuilding another leg higher.
Volume balance story: The pivot between two worlds
The $51.118–$52.395 zone is the line in the sand.
Volume is evenly balanced — neither bulls nor bears hold control — but this balance is unstable.
- Above $52.395 → Buy-side imbalance resumes → breakout toward $54.
- Below $50.60 → Sell-side imbalance resumes → draw to $49–$48.
This equilibrium reflects a coiled-spring structure: energy building beneath resistance, similar to gold’s pre-breakout profile earlier this quarter.
Final takeaway
Silver is standing at a technical crossroads that echoes gold’s structure weeks ago — tight compression, rising demand, and a visible imbalance zone waiting to break.
Reclaiming $52.395 could unleash a fast leg toward $54–$55, validating the idea that silver is becoming “the next gold.”
Failing to do so simply extends the accumulation window around $50–$49, where long-term buyers likely reload for the next wave.
Author

Jasper Osita
Independent Analyst
Jasper has been in the markets since 2019 trading currencies, indices and commodities like Gold. His approach in the market is heavily accompanied by technical analysis, trading Smart Money Concepts (SMC) with fundamentals in mind.

















