WTI oil futures draw a bullish inverted head and shoulders pattern [Video]
![WTI oil futures draw a bullish inverted head and shoulders pattern [Video]](https://editorial.fxstreet.com/images/Markets/Commodities/Energy/Oil/oil-platform-on-the-sea-38503532_XtraLarge.jpg)
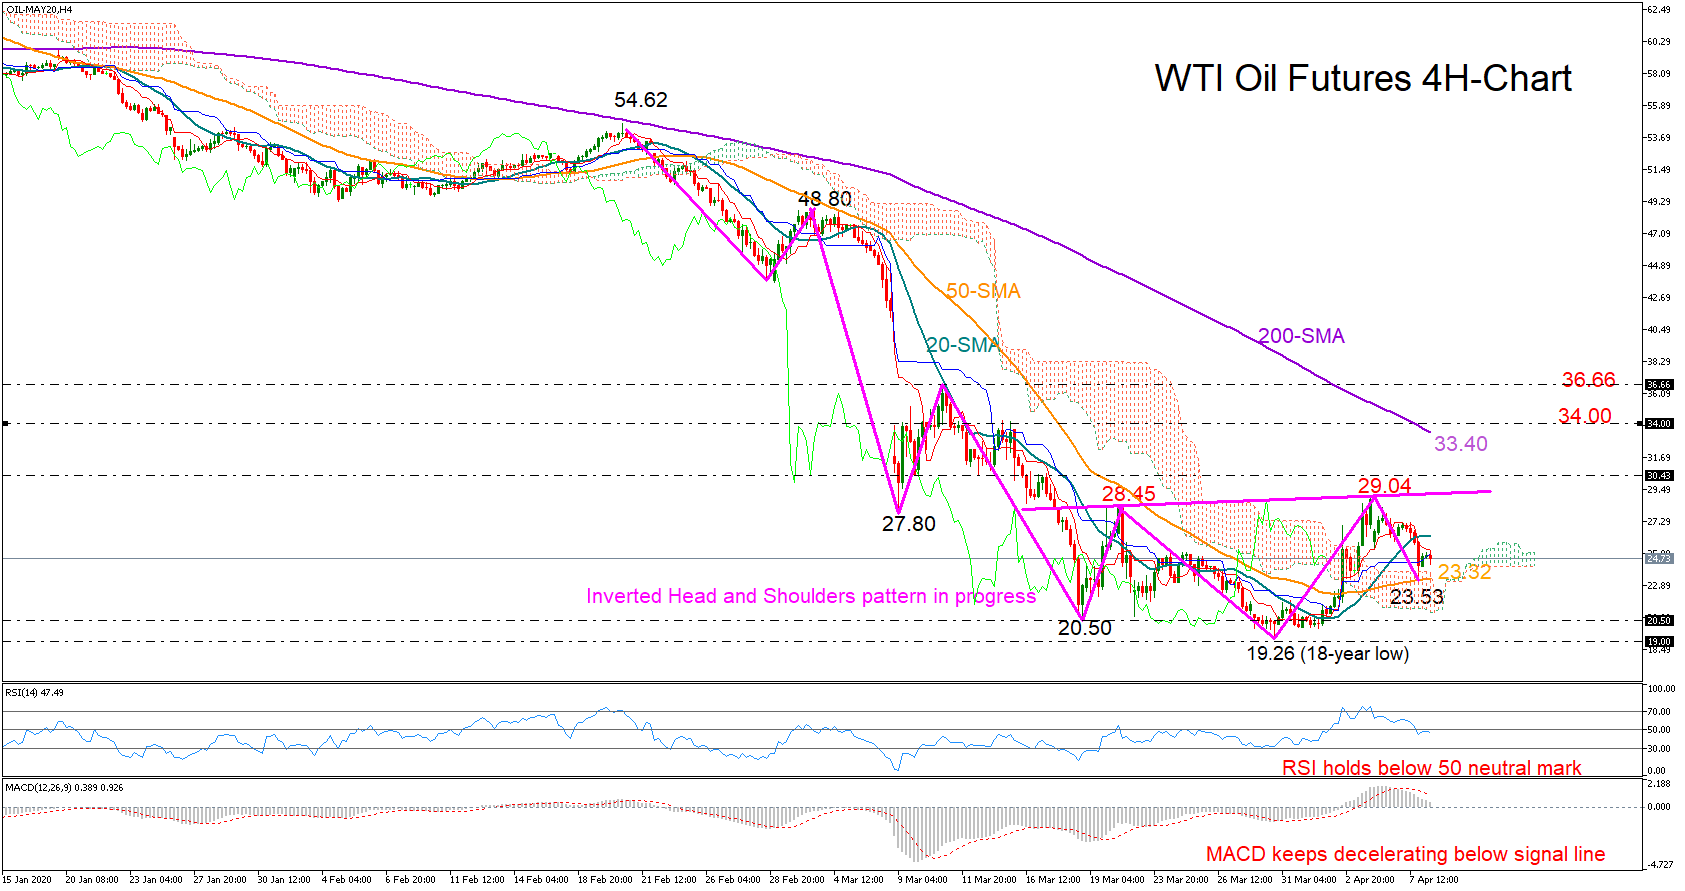
WTI oil futures (May delivery) appear to be forming an inverted head and shoulders pattern in the four-hour timeframe in a possible signal for a positive trend reversal. In the latest upturn, the price failed to overcome its previous high of 28.45 and reversed south to build the right shoulder.
The bullish cross between the 20- and 50-period simple moving averages (SMAs) is also encouraging for a trend improvement.
A decisive rebound above the 29.00 level, where the formation’s neckline is standing, could indicate the start of an uptrend, with traders increasing buying exposure probably towards the 200-period SMA and the 34.00 resistance area. Slightly higher, there is another obstacle around 36.66 that bulls need to successfully overcome to remain in charge.
That said, the momentum indicators are still in a depressing position, suggesting instead that an upside correction may come later than sooner. The RSI seems unable to jump above its 50 neutral mark, while the MACD continues to lose ground below its red signal line. Therefore, some caution may remain in the market, with the 50-period SMA at 23.32 probably grabbing immediate attention if the price further weakens. Below that, all eyes will turn to the left shoulder of 20.50, where any violation would resume fears of a downward trending market, pushing support back to the 19.26 bottom.
In short, the downtrend in WTI oil futures looks to be at risk as a progressing inverted head and shoulders pattern has appeared on the four-hour chart. Traders would wait for a confirmation above the 29.00 level.
Author

Christina joined the XM investment research department in May 2017. She holds a master degree in Economics and Business from the Erasmus University Rotterdam with a specialization in International economics.


