WTI Oil futures at risk of a bearish breakout [Video]
![WTI Oil futures at risk of a bearish breakout [Video]](https://editorial.fxstreet.com/images/Markets/Commodities/Energy/Oil/Oil-WTI-platform-sea_XtraLarge.jpg)
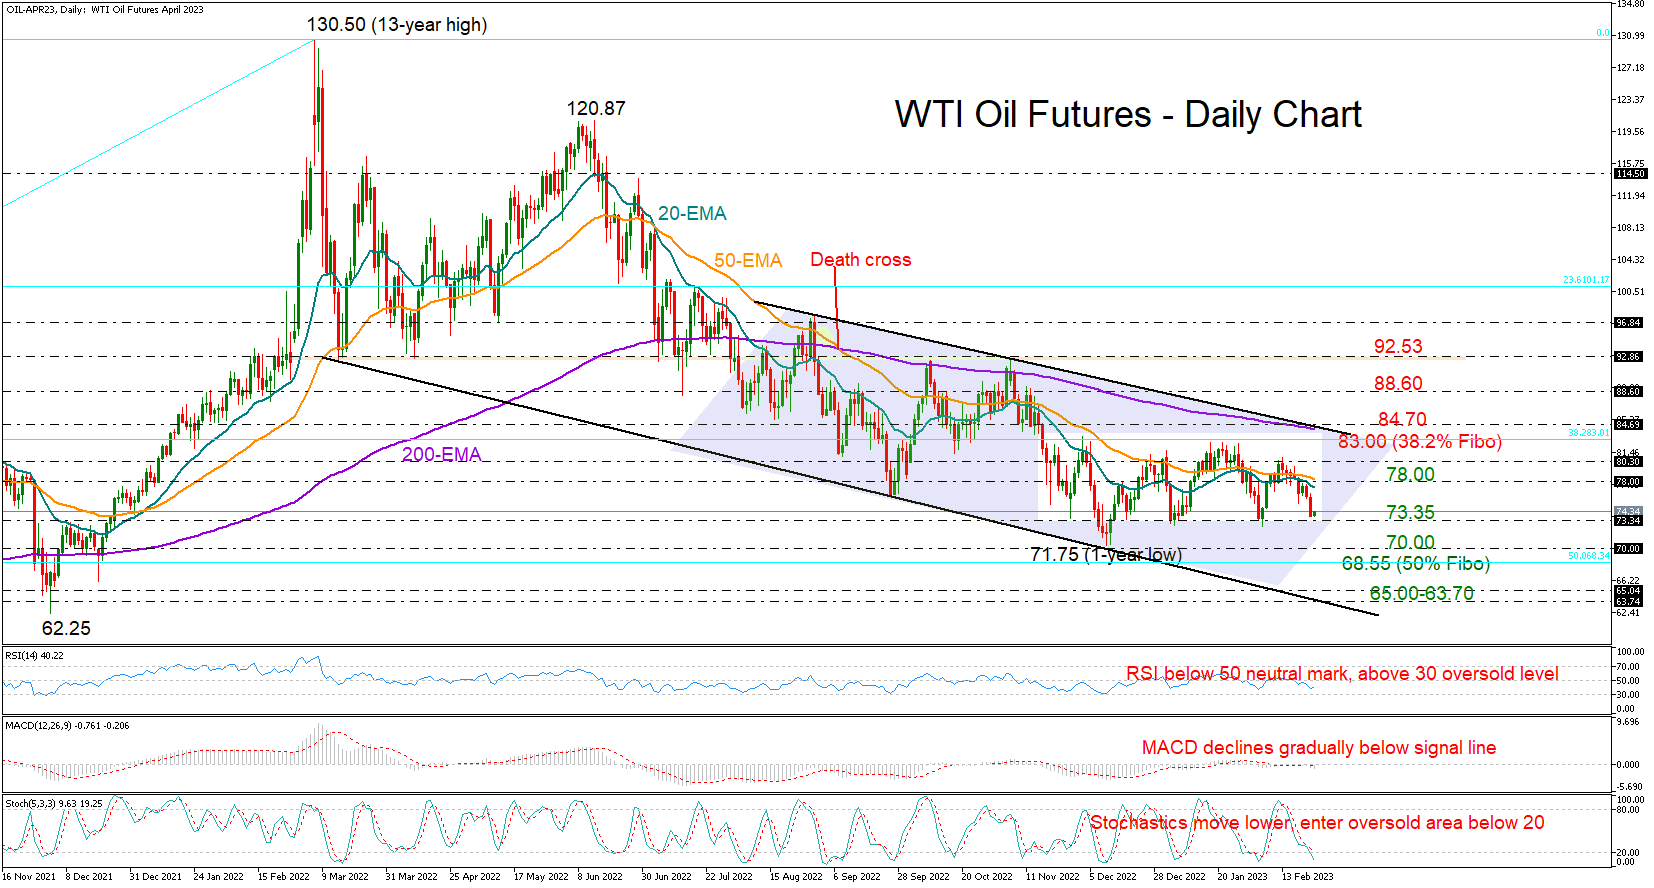
WTI oil futures came under renewed selling pressure on Wednesday, speeding their decline to the bottom of its range area seen around 73.35.
The region has been a significant support zone since the start of the year, making another rebound likely as the Stochastic oscillator is approaching its previous lows below its 20 oversold level. Still, the indicator has not attempted to change direction to the upside, while the falling RSI has yet to reach its 30 oversold level, although it’s close to its February low, both backing a bearish bias.
In other discouraging signs, the 20-day exponential moving average (EMA) could not cross above the 50-day EMA, playing down any hopes for a bullish trend reversal. Besides, the rectangle established at the bottom of the previous downtrend is usually considered a bearish trend continuation pattern.
Hence, the focus will remain on the 73.35 base in the coming sessions, a break of which could initially stall somewhere between the 70.00 psychological mark and the 50% Fibonacci retracement level of the 2020-2021 upleg at 68.55. Additional losses from here could take a breather within the 65.00-63.70 region, where the lower band of the bearish channel from last February is located.
Should the price drift higher, the 78.00 resistance zone, which triggered the latest decline in the market, will come again under examination. If the bulls find enough buying power to pass through that wall this time, closing above last week’s peak of 80.76 too, they may gain direct access to the important 83.00-84.20 area. The 200-day EMA, the channel’s upper band and the 38.2% Fibonacci mark are all located here. Therefore, a sustainable extension higher may prompt a more exciting rally towards the 88.60 barrier.
In brief, WTI oil futures keep facing a bearish bias, remaining exposed to a breakout below the existing rectangle.
Author

Christina joined the XM investment research department in May 2017. She holds a master degree in Economics and Business from the Erasmus University Rotterdam with a specialization in International economics.


