WTI Oil: Further downside?

Front page news this morning focussed on the ceasefire between Israel and Iran, first announced by US President Donald Trump on his Truth Social platform. However, reports recently emerged of Iran firing missiles, seemingly violating the ceasefire, but no confirmation has been received yet. The point is that things remain somewhat uncertain as of writing.
The technical front, nevertheless, is interesting on WTI Oil (West Texas Intermediate), and ultimately points to a moderate pullback before heading lower.
Monthly descending triangle in play
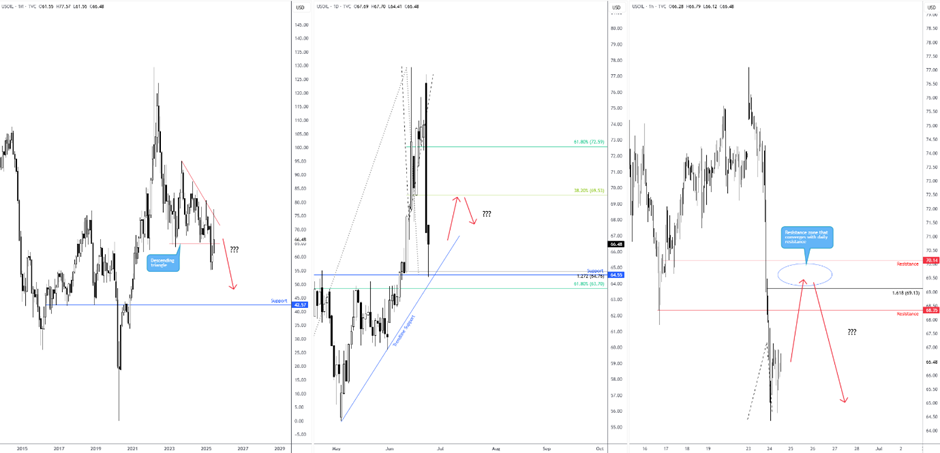
The flow on the monthly chart reveals that price action completed a descending triangle in April this year, formed between US$95.00 and US$64.41. Following the breach of the lower boundary and refreshing year-to-date (YTD) lows of US$55.15, a determined pullback materialised and resulted in the unit testing the upper barrier of the pattern. As you can see, the test has held for now, with June poised to end the month considerably off its best levels.
Given that price has aggressively rejected the upper boundary of the triangle formation, and if we see WTI push to fresh YTD lows, this would unearth a possible bearish scenario in the direction of support from US$42.57.
Daily fibonacci resistance
Across the page on the daily chart, you will note that recent flow touched gloves with support at US$64.55, a level complemented by a 1.272% Fibonacci projection ratio at US$64.76, a trendline support (extended from the low of US$55.40), and a neighbouring 61.8% Fibonacci retracement level at US$63.70. Given that the 1.272% Fibonacci projection ratio also represents an ‘alternate’ AB=CD support pattern, traders that are long from US$64.55 may aim for the 38.2% and 61.8% Fibonacci retracement ratios of US$69.53 and US$72.59. Consequently, both of these lines serve as potential resistance levels to watch.
H1 confluence
With monthly price suggesting further selling, and daily resistance on the table, the H1 chart shines the spotlight on two levels of resistance at US$68.35 and US$70.14. However, I am more drawn to the latter level as a potential resistance. This is because it converges closely with the 38.2% Fibonacci retracement ratio on the daily timeframe mentioned above at US$69.53, as well as a nearby 1.618% Fibonacci projection ratio on the H1 chart at US$69.13.
As a result, my focus will be on H1 resistance between US$70.14 and US$69.13.
Author

Aaron Hill
FP Markets
After completing his Bachelor’s degree in English and Creative Writing in the UK, and subsequently spending a handful of years teaching English as a foreign language teacher around Asia, Aaron was introduced to financial trading,


