Will there a Santa Claus rally this year? [Video]
![Will there a Santa Claus rally this year? [Video]](https://editorial.fxstreet.com/images/Macroeconomics/Countries/America/Argentina/argentina-dawn-over-church-of-san-francisco-in-salta-16068265_XtraLarge.jpg)
US Dollar: Dec '22 USD is Down at 104.095.
Energies: Jan '23 Crude is Up at 74.83.
Financials: The Mar '23 30 Year T-Bond is Down 23 ticks and trading at 130.13.
Indices: The Dec '22 S&P 500 Emini ES contract is 72 ticks Higher and trading at 3897.00.
Gold: The Feb'23 Gold contract is trading Up at 1806.20. Gold is 60 ticks Higher than its close.
Initial conclusion
This is not a correlated market. The dollar is Down, and Crude is Up which is normal, and the 30 Year T-Bond is trading Lower. The Financials should always correlate with the US dollar such that if the dollar is lower, then the bonds should follow and vice-versa. The S&P is Higher, and Crude is trading Higher which is not correlated. Gold is trading Higher which is correlated with the US dollar trading Down. I tend to believe that Gold has an inverse relationship with the US Dollar as when the US Dollar is down, Gold tends to rise in value and vice-versa. Think of it as a seesaw, when one is up the other should be down. I point this out to you to make you aware that when we don't have a correlated market, it means something is wrong. As traders you need to be aware of this and proceed with your eyes wide open. Currently all of Asia is trading Lower with the exception of the Sensex and Singapore exchanges. All of Europe is trading Higher. .
Possible challenges to traders today
-
NAHB Housing Market Index is out at 10 AM EST. Major.
-
Lack of Majo Economic News.
Treasuries
Traders, please note that we've changed the Bond instrument from the 30 year (ZB) to the 10 year (ZN). They work exactly the same.
We've elected to switch gears a bit and show correlation between the 10-year bond (ZN) and the S&P futures contract. The S&P contract is the Standard and Poor's, and the purpose is to show reverse correlation between the two instruments. Remember it's likened to a seesaw, when up goes up the other should go down and vice versa.
On Friday the ZN hit a Low at around 9:50 AM EST. The S&P was in a downswing at around the same time. If you look at the charts below ZN gave a signal at around 9:50 AM and the S&P gave a signal at around the same time. Look at the charts below and you'll see a pattern for both assets. S&P hit a High at around 9:50 AM and continued its Downward trend. These charts represent the newest version of MultiCharts and I've changed the timeframe to a 15-minute chart to display better. This represented a Long opportunity on the 10-year note, as a trader you could have netted about 30 plus ticks per contract on this trade. Each tick is worth $15.625. Please note: the front month for the ZN is now Mar '23. The S&P contract is still Dec' 22. I've changed the format to Renko Bars such that it may be more apparent and visible.
Charts courtesy of MultiCharts built on an AMP platform

ZN - Mar 2023 - 12/16/22
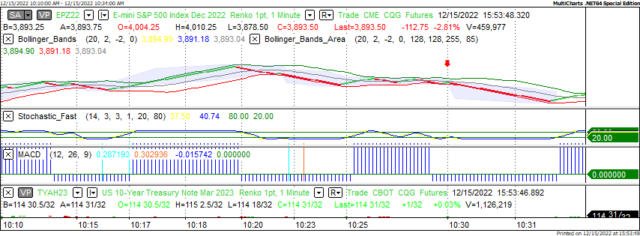
S&P - Dec 2022 - 12/16/22
Bias
On Friday we gave the markets a Neutral bias as we didn't see much in the way of correlation Friday morning. The markets continued its downward trend as the Dow dropped 282 points and the other indices lost ground as well. Today we aren't dealing with a correlated market and our bias is to the Upside.
Could this change? Of Course. Remember anything can happen in a volatile market.
Commentary
Last Friday morning when we viewed the markets, we kind of assumed that we might see a dead cat bounce as the markets had dropped dramatically Thursday. No such luck. The markets continued its downward spiral as the Dow dropped 282 points and the other dropped as well. We think the market are more afraid of the potential of a looming recession. Why? Well, the Fed insinuated as much Wednesday when they conducted their press conference basically stating that the Overnight Rate would rise to 5,25% and that unemployment and layoffs would occur. This does not bode well for an Upside market hence the indices dropped Friday, and we don't see the prospect of a Santa Claus rally this year. Could this change?? Of course, anything is possible in a volatile market.
Author

Nick Mastrandrea
Market Tea Leaves


