Will the Federal Reserve lower interest rates at the September meeting?
USD: Sept '24 is Up at 102.425.
Energies: Sept '24 Crude is Up at 76.48.
Financials: The Sept '24 30 Year T-Bond is Down 12 ticks and trading at 124.07.
Indices: The Sept '24 S&P 500 emini ES contract is 46 ticks Higher and trading at 5488.50.
Gold: The Dec'24 Gold contract is trading Up at 2497.00.
Initial conclusion
This is not a correlated market. The USD is Up and Crude is Up which is not normal, but the 30 Year T-Bond is trading Down. The Financials should always correlate with the US dollar such that if the dollar is Higher, then the bonds should follow and vice-versa. The S&P is Higher and Crude is trading Higher which is not correlated. Gold is trading Higher which is not correlated with the US dollar trading Up. I tend to believe that Gold has an inverse relationship with the US Dollar as when the US Dollar is down, Gold tends to rise in value and vice-versa. Think of it as a seesaw, when one is up the other should be down. I point this out to you to make you aware that when we don't have a correlated market, it means something is wrong. As traders you need to be aware of this and proceed with your eyes wide open. Asia traded mainly Higher with the exception of the Aussies and Hang Seng exchanges which traded Lower. All of Europe is trading mainly Higher except the Paris and Spanish exchange.
Possible challenges to traders
-
Core Retail Sales m/m is out at 8:30 AM EST. This is Major.
-
Retail Sales m/m is out at 8:30 AM EST. This is Major.
-
Unemployment Claims is out at 8:30 AM EST. This is Major.
-
Empire State Manufacturing Index is out at 8:30 AM EST. This is Major.
-
Philly Fed Manufacturing Index is out at 8:30 AM EST. This is Major.
-
Import Prices m/m is out at 8:30 AM EST. This is Major.
-
FOMC Member Musalem Speaks at 9:10 AM EST. This is Major.
-
Capacity Utilization Rate is out at 9:15 AM EST. This is Major.
-
Industrial Production m/m is out at 9:15 AM EST. This is Major.
-
Business Inventories m/m is out at 10 AM EST. This is Major.
-
NAHB Housing Market Index is out at 10 AM EST. This is Major.
-
Mortgage Delinquencies - tentative. Not Major.
-
Natural Gas Storage is out at 10:30 AM EST. This is Major.
-
FOMC Member Harker Speaks at 1:10 PM EST. This is Major.
-
TIC Long-Term Purchases is out at 4 PM EST. This is Major.
Traders, please note that we've changed the Bond instrument from the 10 year (ZN) to the 2 year (ZT). They work exactly the same.
We've elected to switch gears a bit and show correlation between the 10-year Treasury notes (ZN) and the S&P futures contract. The YM contract is the Dow Jones Industrial Average, and the purpose is to show reverse correlation between the two instruments. Remember it's likened to a seesaw, when up goes up the other should go down and vice versa.
Yesterday the ZT migrated Higher at around 8:30 AM EST. If you look at the charts below the ZT gave a signal at around 8:30 AM after the CPI data was released and started its Downward slide. Look at the charts below and you'll see a pattern for both assets. The Dow moved Lower at 8:30 AM and the ZT moved Higher at around the same time. These charts represent the newest version of BarCharts, and I've changed the timeframe to a 15-minute chart to display better. This represented a Long opportunity on the 2-year note, as a trader you could have netted about 40 plus ticks per contract on this trade. Each tick is worth $7.625. Please note: the front month for ZT is Sept and the Dow is now Sept '24. I've changed the format to filled Candlesticks (not hollow) such that it may be more apparent and visible.
Charts courtesy of barcharts
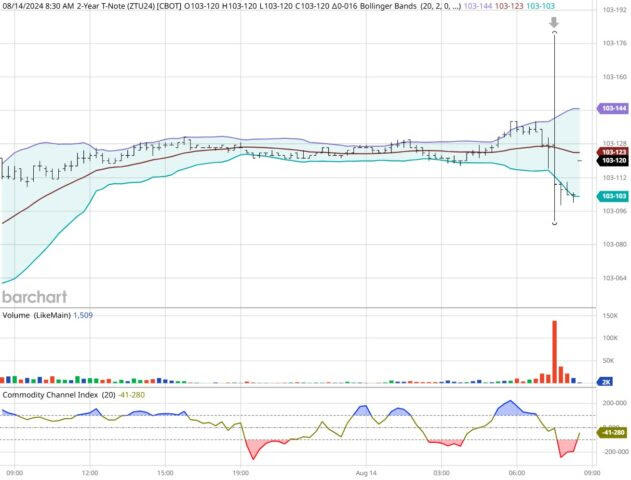
ZT -Sept 2024 - 08/14.24
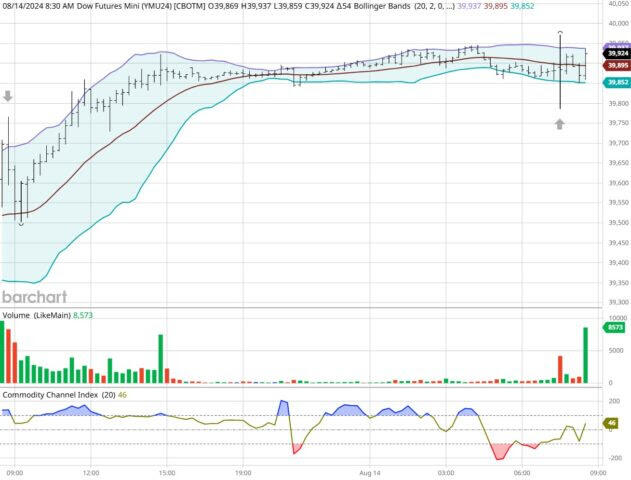
Dow - Sept 2024- 08/14/24
Bias
Yesterday we gave the markets a Neutral or Mixed bias and up until 5 minutes before the markets closed, they were Mixed but the Nasdaq closed up 5 points for an Upside Day. The Dow gained 243 points, and the other indices gained ground as well. Today we aren't dealing with a correlated market and will maintain a Neutral or Mixed bias. Why? Because we have an unprecedented 16 economic reports, most of which are major and could drive this market in any direction.
Could this change? Of Course. Remember anything can happen in a volatile market.
Commentary
Yesterday all eyes were on the CPI report released at 8:30 AM EST. The numbers came in positive as the CPI came in at less than 3% where it has not been since 2021. The markets migrated into positive territory on the news and now it is suggested that the Federal Reserve will lower interest rates at the September meeting. I'm not necessarily convinced that the Fed will do that as there may be some Hawks on board who might suggest that CPI should be lower before they decide to lower rates. The argument might be that their threshold is 2% CPI or Lower and whereas 2.9% is Lower than 3, there may be some who would suggest that the Federal Funds Rate should remain High until CPI meets the Fed threshold. This by the way is pure subjection on my part but I wouldn't be surprised if they did that.
Author

Nick Mastrandrea
Market Tea Leaves


