Will be interesting to see how the markets react to the news [Video]
![Will be interesting to see how the markets react to the news [Video]](https://editorial.fxstreet.com/images/TechnicalAnalysis/Intermarket/Correlation/greasy-gears-in-the-machine-gm503847604-82780433_XtraLarge.jpg)
US Dollar: Jun '22 USD is Down at 102.050.
Energies: Jul '22 Crude is Down at 109.79.
Financials: The Jun '22 30 Year bond is Up 26 ticks and trading at 141.03.
Indices: The Jun '22 S&P 500 emini ES contract is 188 ticks Lower and trading at 3924.00.
Gold: The Jun'22 Gold contract is trading Up at 1855.70. Gold is 79 ticks Higher than its close.
Initial conclusion
This is not a correlated market. The dollar is Down, and Crude is Down which is not normal, but the 30-year Bond is trading Higher. The Financials should always correlate with the US dollar such that if the dollar is lower, then the bonds should follow and vice-versa. The S&P is Lower, and Crude is trading Lower which is not correlated. Gold is trading Higher which is correlated with the US dollar trading Down. I tend to believe that Gold has an inverse relationship with the US Dollar as when the US Dollar is down, Gold tends to rise in value and vice-versa. Think of it as a seesaw, when one is up the other should be down. I point this out to you to make you aware that when we don't have a correlated market, it means something is wrong. As traders you need to be aware of this and proceed with your eyes wide open. All of Asia is trading Lower. Currently all of Europe is trading Lower as well.
Possible thallenges to traders today
-
Flash Manufacturing PMI is out at 9:45 AM EST. This is Major.
-
Flash Services PMI is out at 9:45 AM EST. This is Major.
-
New Home Sales is out at 10 AM EST. This is Major.
-
Richmond Manufacturing Index is out at 10 AM EST. Major.
-
Fed Chair Powell Speaks at 12:20 PM EST. This is Major.
Treasuries
Traders, please note that we've changed the Bond instrument from the 30 year (ZB) to the 10 year (ZN). They work exactly the same.
We've elected to switch gears a bit and show correlation between the 10-year bond (ZN) and the S&P futures contract. The S&P contract is the Standard and Poor's, and the purpose is to show reverse correlation between the two instruments. Remember it's likened to a seesaw, when up goes up the other should go down and vice versa.
Yesterday the ZN made its move at around 10:50 AM EST. The ZN hit a High at around that time and the S&P moved Higher shortly thereafter. If you look at the charts below ZN gave a signal at around 10:50 AM EST and the S&P moved Higher at around the same time. Look at the charts below and you'll see a pattern for both assets. ZN hit a High at around 10:50 AM EST and the S&P was moving Higher shortly thereafter. These charts represent the newest version of MultiCharts and I've changed the timeframe to a 15-minute chart to display better. This represented a Shorting opportunity on the 10-year note, as a trader you could have netted about 20 ticks per contract on this trade. Each tick is worth $15.625. Please note: the front month for the ZN is now Jun '22. The S&P contract is also Jun' 22 as well. I've changed the format to Heikin-Ashi such that it may be more apparent and visible.
Charts courtesy of MultiCharts built on an AMP platform
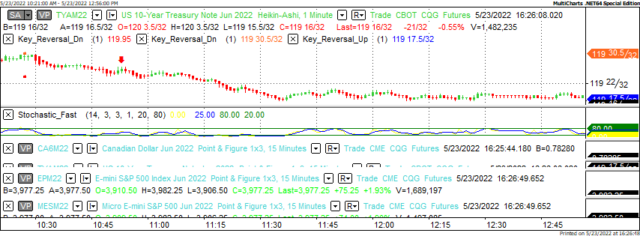
ZN - Jun 2022 - 05/23/22
-637889861161519372.png)
S&P - Jun 2022 - 05/23/22
Bias
Yesterday we gave the markets an Upside bias as both the bonds and crude were trading Lower.The markets didn't disappoint as the Dow gained 618 points on the session and the other indices closed Higher as well. Today we aren't dealing with a correlated market and our bias is to the Downside.
Could this change? Of Course. Remember anything can happen in a volatile market.
Commentary
Yesterday liken to Friday we had no economic news to drive the markets in one direction or another however what started as an up session on Friday really brought fruit yesterday as the Dow went Higher by about 620 points and the other indices soared Higher as well. So what brough this about? Our take that because there was no economic news yesterday, this was a dead cat bounce. That's when the market goes so low that it can only reverse and go Higher. Today unlike the previous sessions, we do have economic news to report. It will be interesting to see how the markets react to the news.
Author

Nick Mastrandrea
Market Tea Leaves


