|

Why the US Indices are Reaching Critical Levels

Last month I explained how super long term cycles are coming together in the S&P500 and DJIA (15th October).

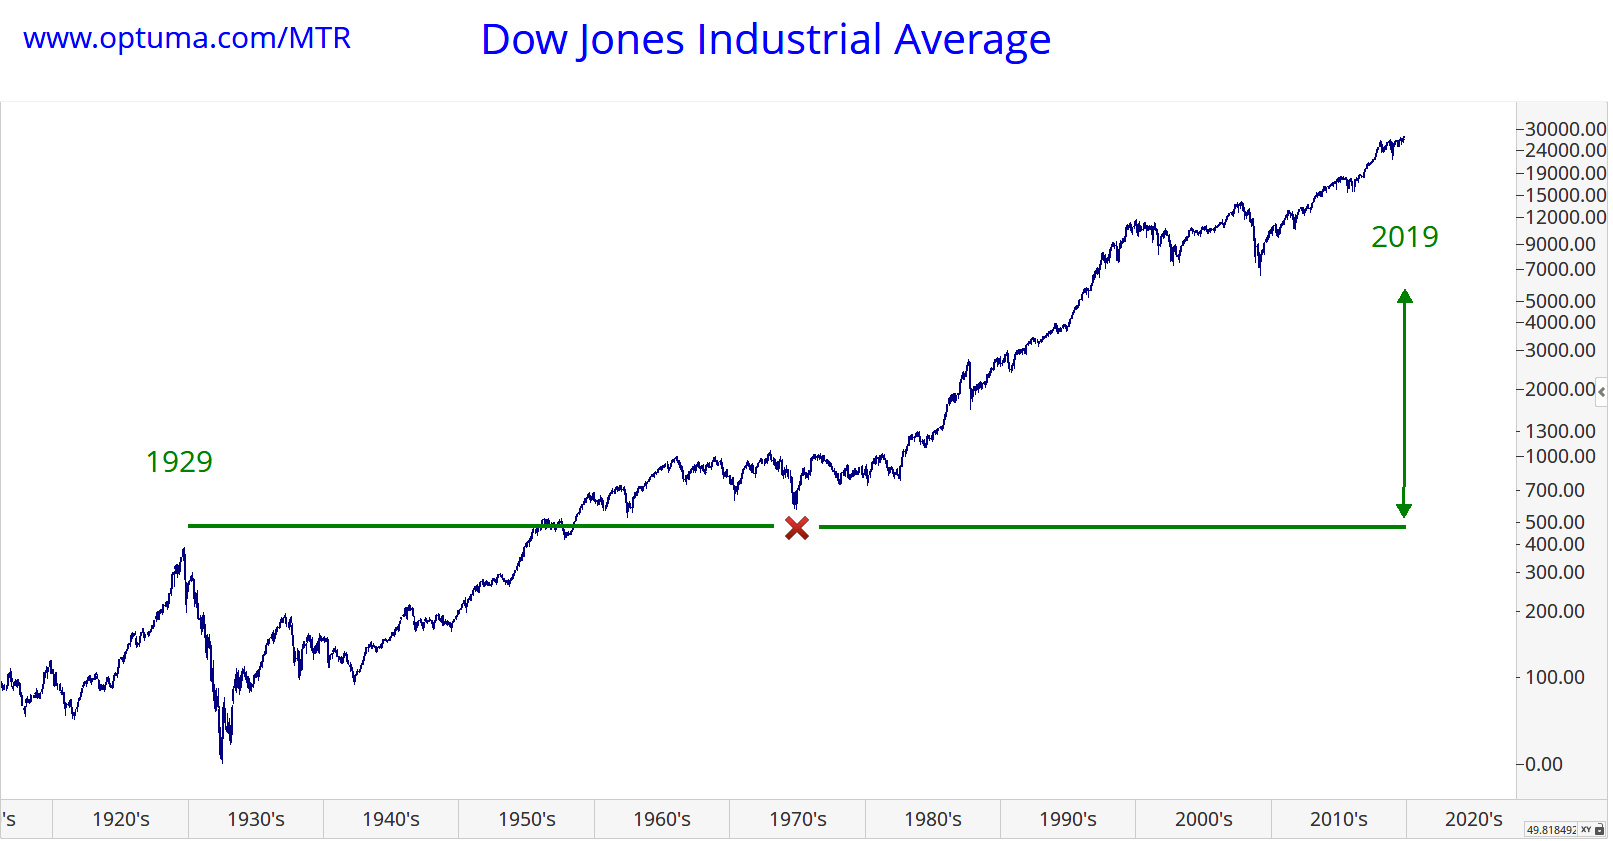
In a nutshell, we are 90 years on from the 1929 Crash and also 45 years on from the major low on 1974 which was caused by the OPEC oil crisis.

Very few people understand the value of super long term cycles but they are key to forecasting. They seem to time crowd behaviour. Ninety years prior to the 1929 collapse there was a major panic from 1837 to 1841 leading to “The Long Depression” in the USA and 45 years after that saw financial troubles.

DJ

All this suggests that we need to exercise caution.

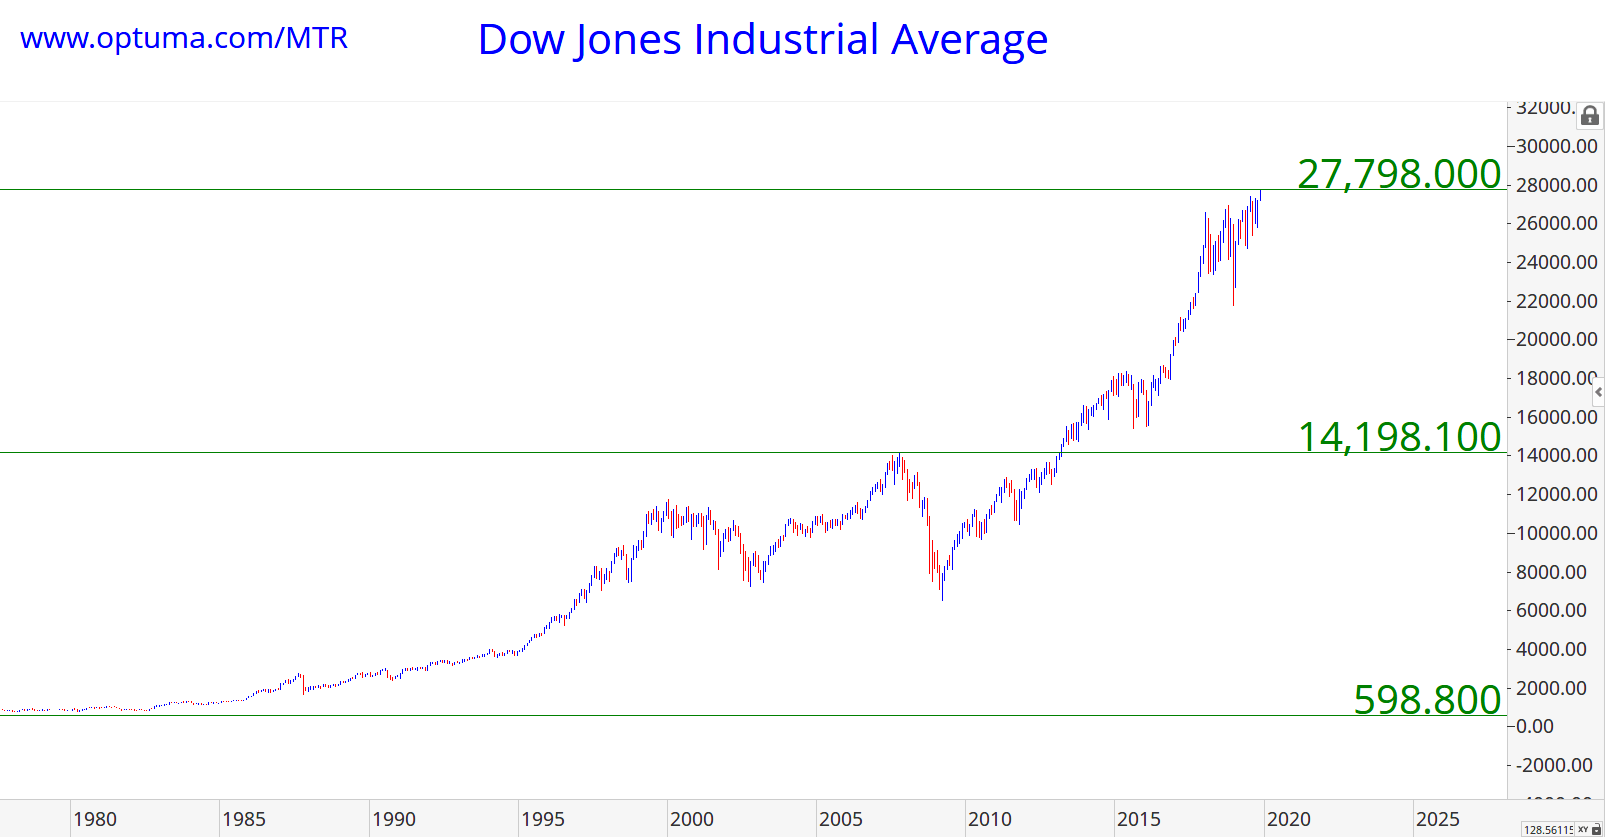
Markets often reach significant targets when they double in price.

And this is exactly what we are seeing now.    

So we have time factors AND price factors in play. For students of the works of Gann – this is known as price squaring time.

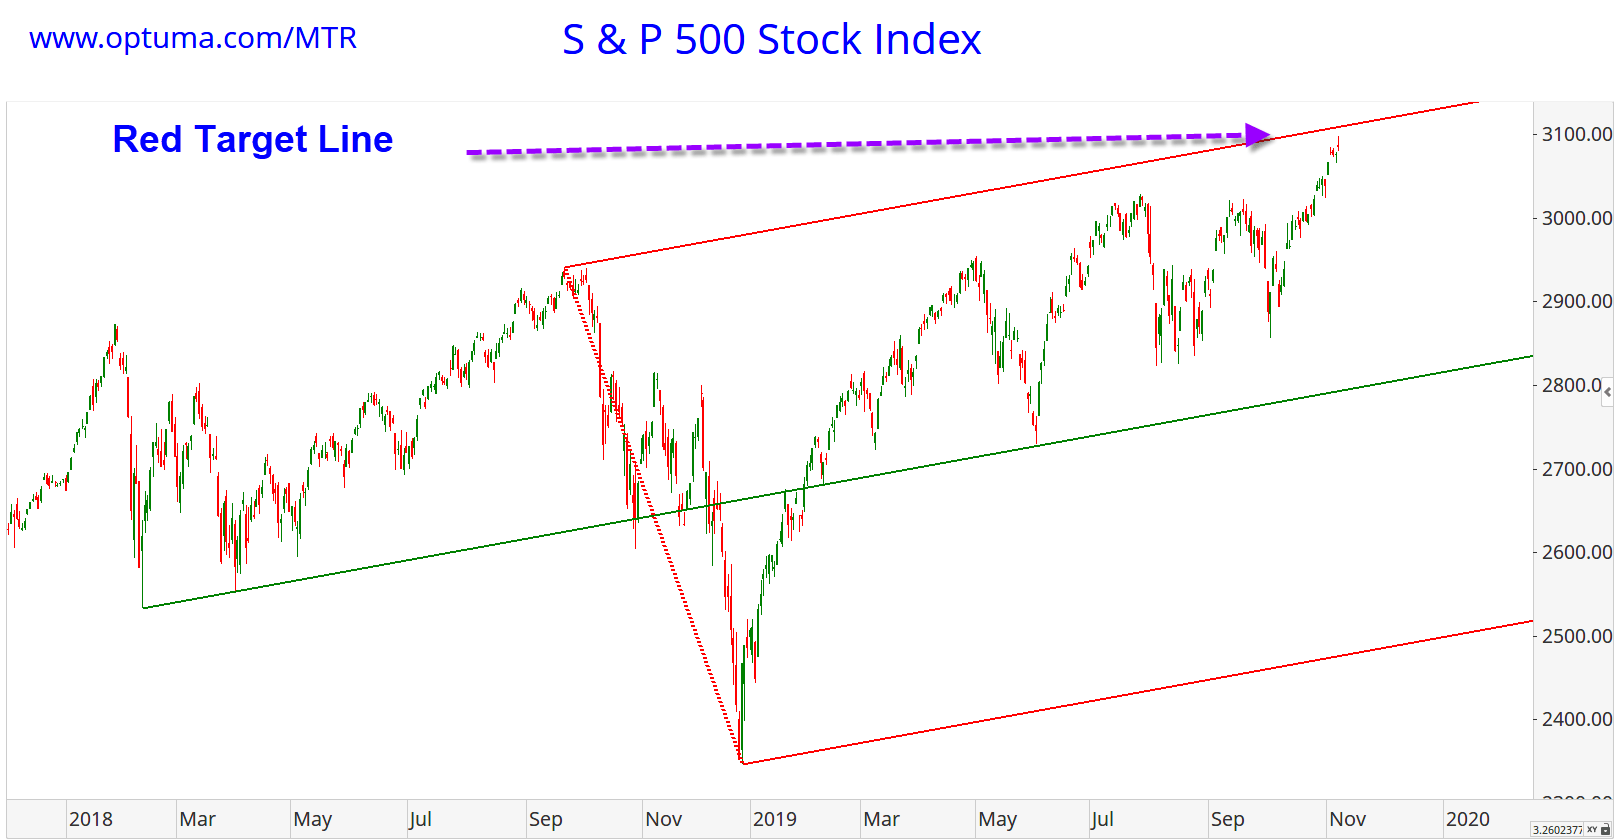
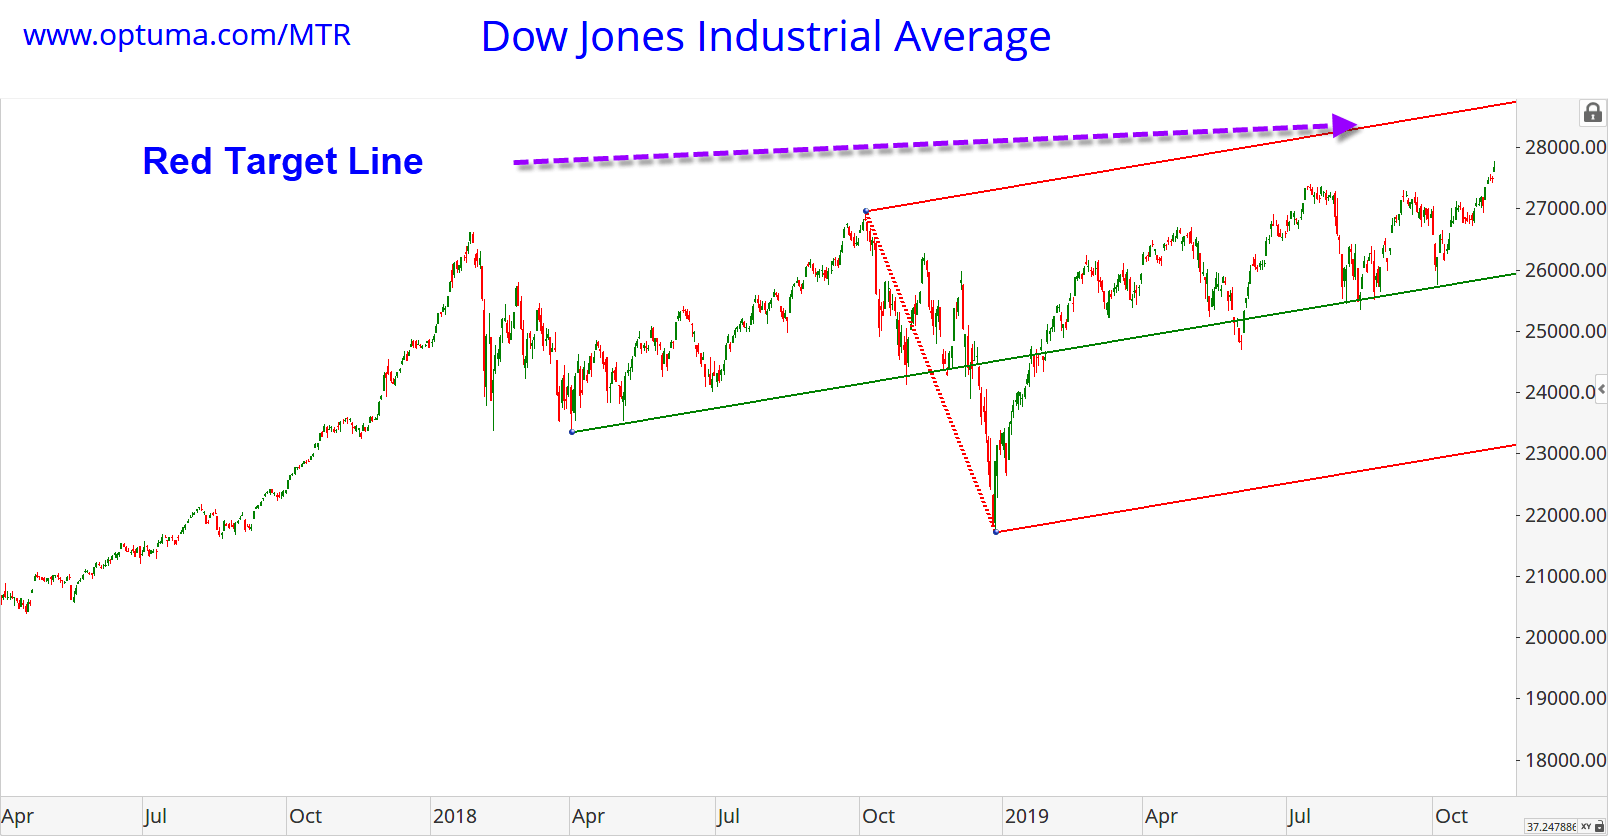
Taking the range from the low from 1974 to the tops of 2000 and 2007 and doubling them, we see price targets of 3091 on the S&P500 and around 27,800 on the Dow Jones Industrial Averages.

SP
DJ

This suggests that the markets may start heading out of steam fairly shortly.

However it is always possible that these targets can be exceeded by a few percent. A 3% exceedance would represent over 90 points on the S&P500 and nearly 900 points on the Dow 30.

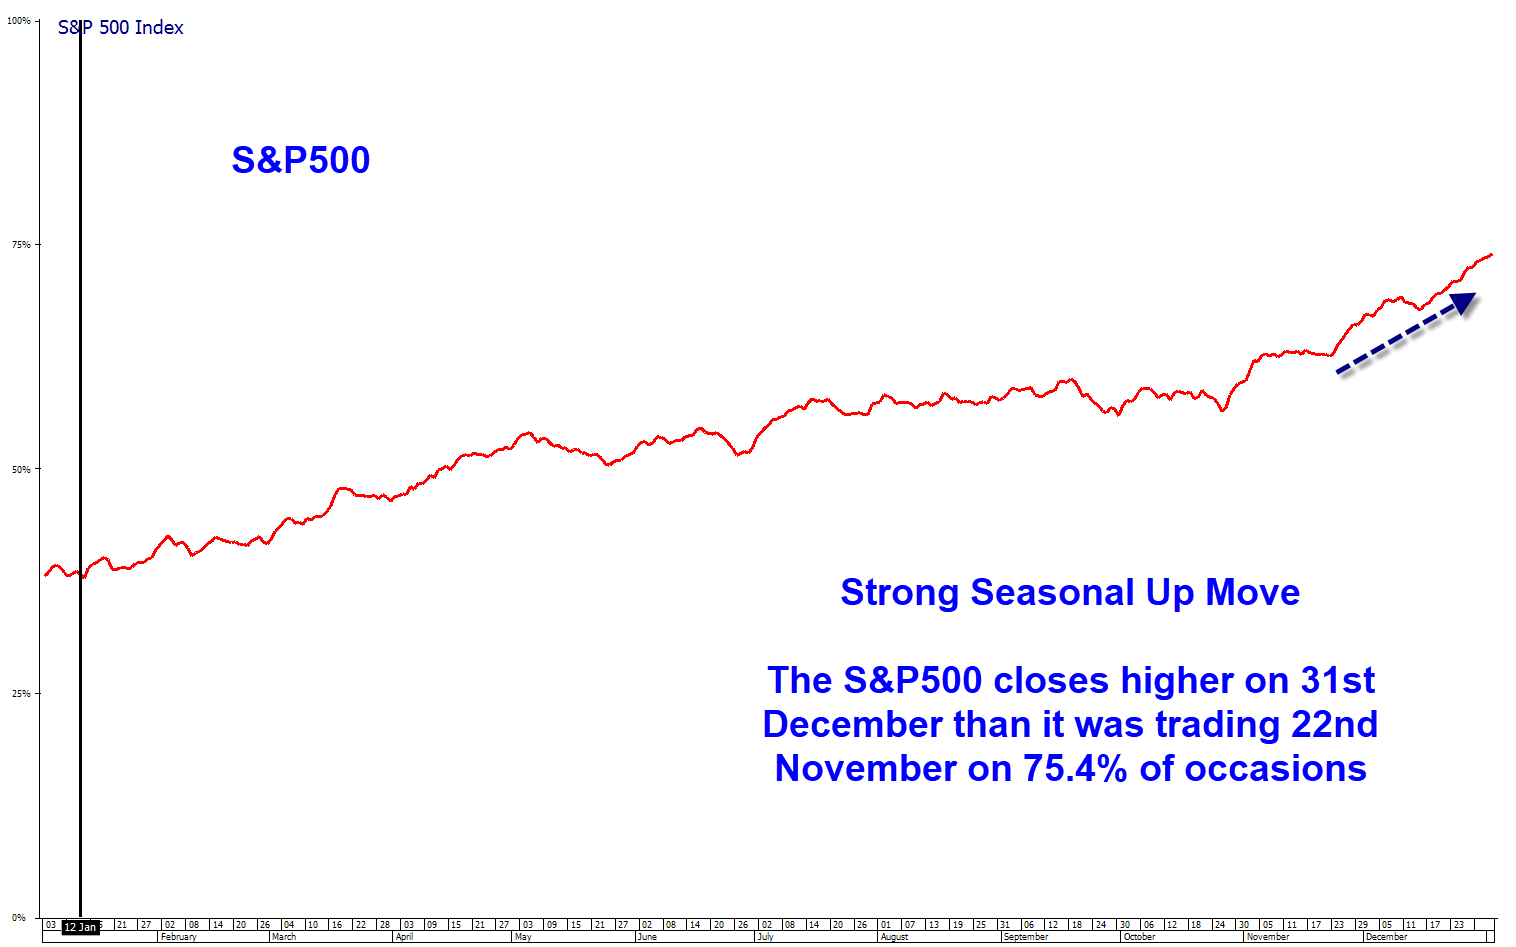
Additionally, seasonally, since 1950, the S&P500 has typically closed higher on the last day of the year than it was trading on 22nd November on 75.4% of occasions. We are entering the bullish phase of the year.

SP
Let’s now add to this our proprietary timing model. In this chart you will see a histogram below the chart. These histograms project into the future and where they spike the market has a high reversal probability. (We use a series of these cycle sets and only the main set is shown for clarity in the chart below). The next clear spike is showing for the week ending 20th December 2019. This is a potential window for a major turn.

Finally, zooming into the present and fine tuning the markets, here are two charts with Andrew Pitchforks added. The upper parallel red lines are potential price targets and levels that we should all be aware of.

SP
DJ

The bottom line is that we are approaching major price targets and major time cycles. We could be seeing the latter phases of this ten year bull market. However in the short term we are likely to head higher.

Author

Andrew Pancholi

Andrew Pancholi

Market Timing Report

Andrew Pancholi is a world-renowned trading expert specializing in market timing.

More from Andrew Pancholi
Share:

Editor's Picks

EUR/USD weakens as US jobs data trims Fed rate cut bets

The EUR/USD pair trades in negative territory for the third consecutive day near 1.1860 during the early European session on Thursday. Traders will keep an eye on the US weekly Initial Jobless Claims data. On Friday, the attention will shift to the US Consumer Price Index inflation report. 

GBP/USD bullish outlook prevails above 1.3600, UK GDP data looms

The GBP/USD pair gains ground near 1.3635, snapping the two-day losing streak during the early European session on Thursday. The preliminary reading of UK Gross Domestic Product for the fourth quarter will be closely watched later on Thursday. The UK economy is estimated to grow 0.2% QoQ in Q4, versus 0.1% in Q1. 

Gold remains on the defensive below two-week top; lacks bearish conviction amid mixed cues

Gold sticks to modest intraday losses through the Asian session on Thursday, though it lacks follow-through selling and remains close to a nearly two-week high, touched the previous day. The commodity currently trades above the $5,070 level, down just over 0.20% for the day, amid mixed cues.

UK GDP set to post weak growth as markets rise bets on March rate cut

Markets will be watching closely on Thursday, when the United Kingdom’s Office for National Statistics will release the advance estimate of Q4 Gross Domestic Product. If the data land in line with consensus, the UK economy would have continued to grow at an annualised pace of 1.2%, compared with 1.3% recorded the previous year. 

The market trades the path not the past

The payroll number did not just beat. It reset the tone. 130,000 vs. 65,000 expected, with a 35,000 whisper. 79 of 80 economists leaning the wrong way. Unemployment and underemployment are edging lower. For all the statistical fog around birth-death adjustments and seasonal quirks, the core message was unmistakable. The labour market is not cracking.

Sonic Labs’ vertical integration fuels recovery in S token

Sonic, previously Fantom (FTM), is extending its recovery trade at $0.048 at the time of writing, after rebounding by over 12% the previous day. The recovery thesis’ strengths lie in the optimism surrounding Sonic Labs’ Wednesday announcement to shift to a vertically integrated model, aimed at boosting S token utility.