Why the EU still holds a Trump card in the face of rising trade tensions
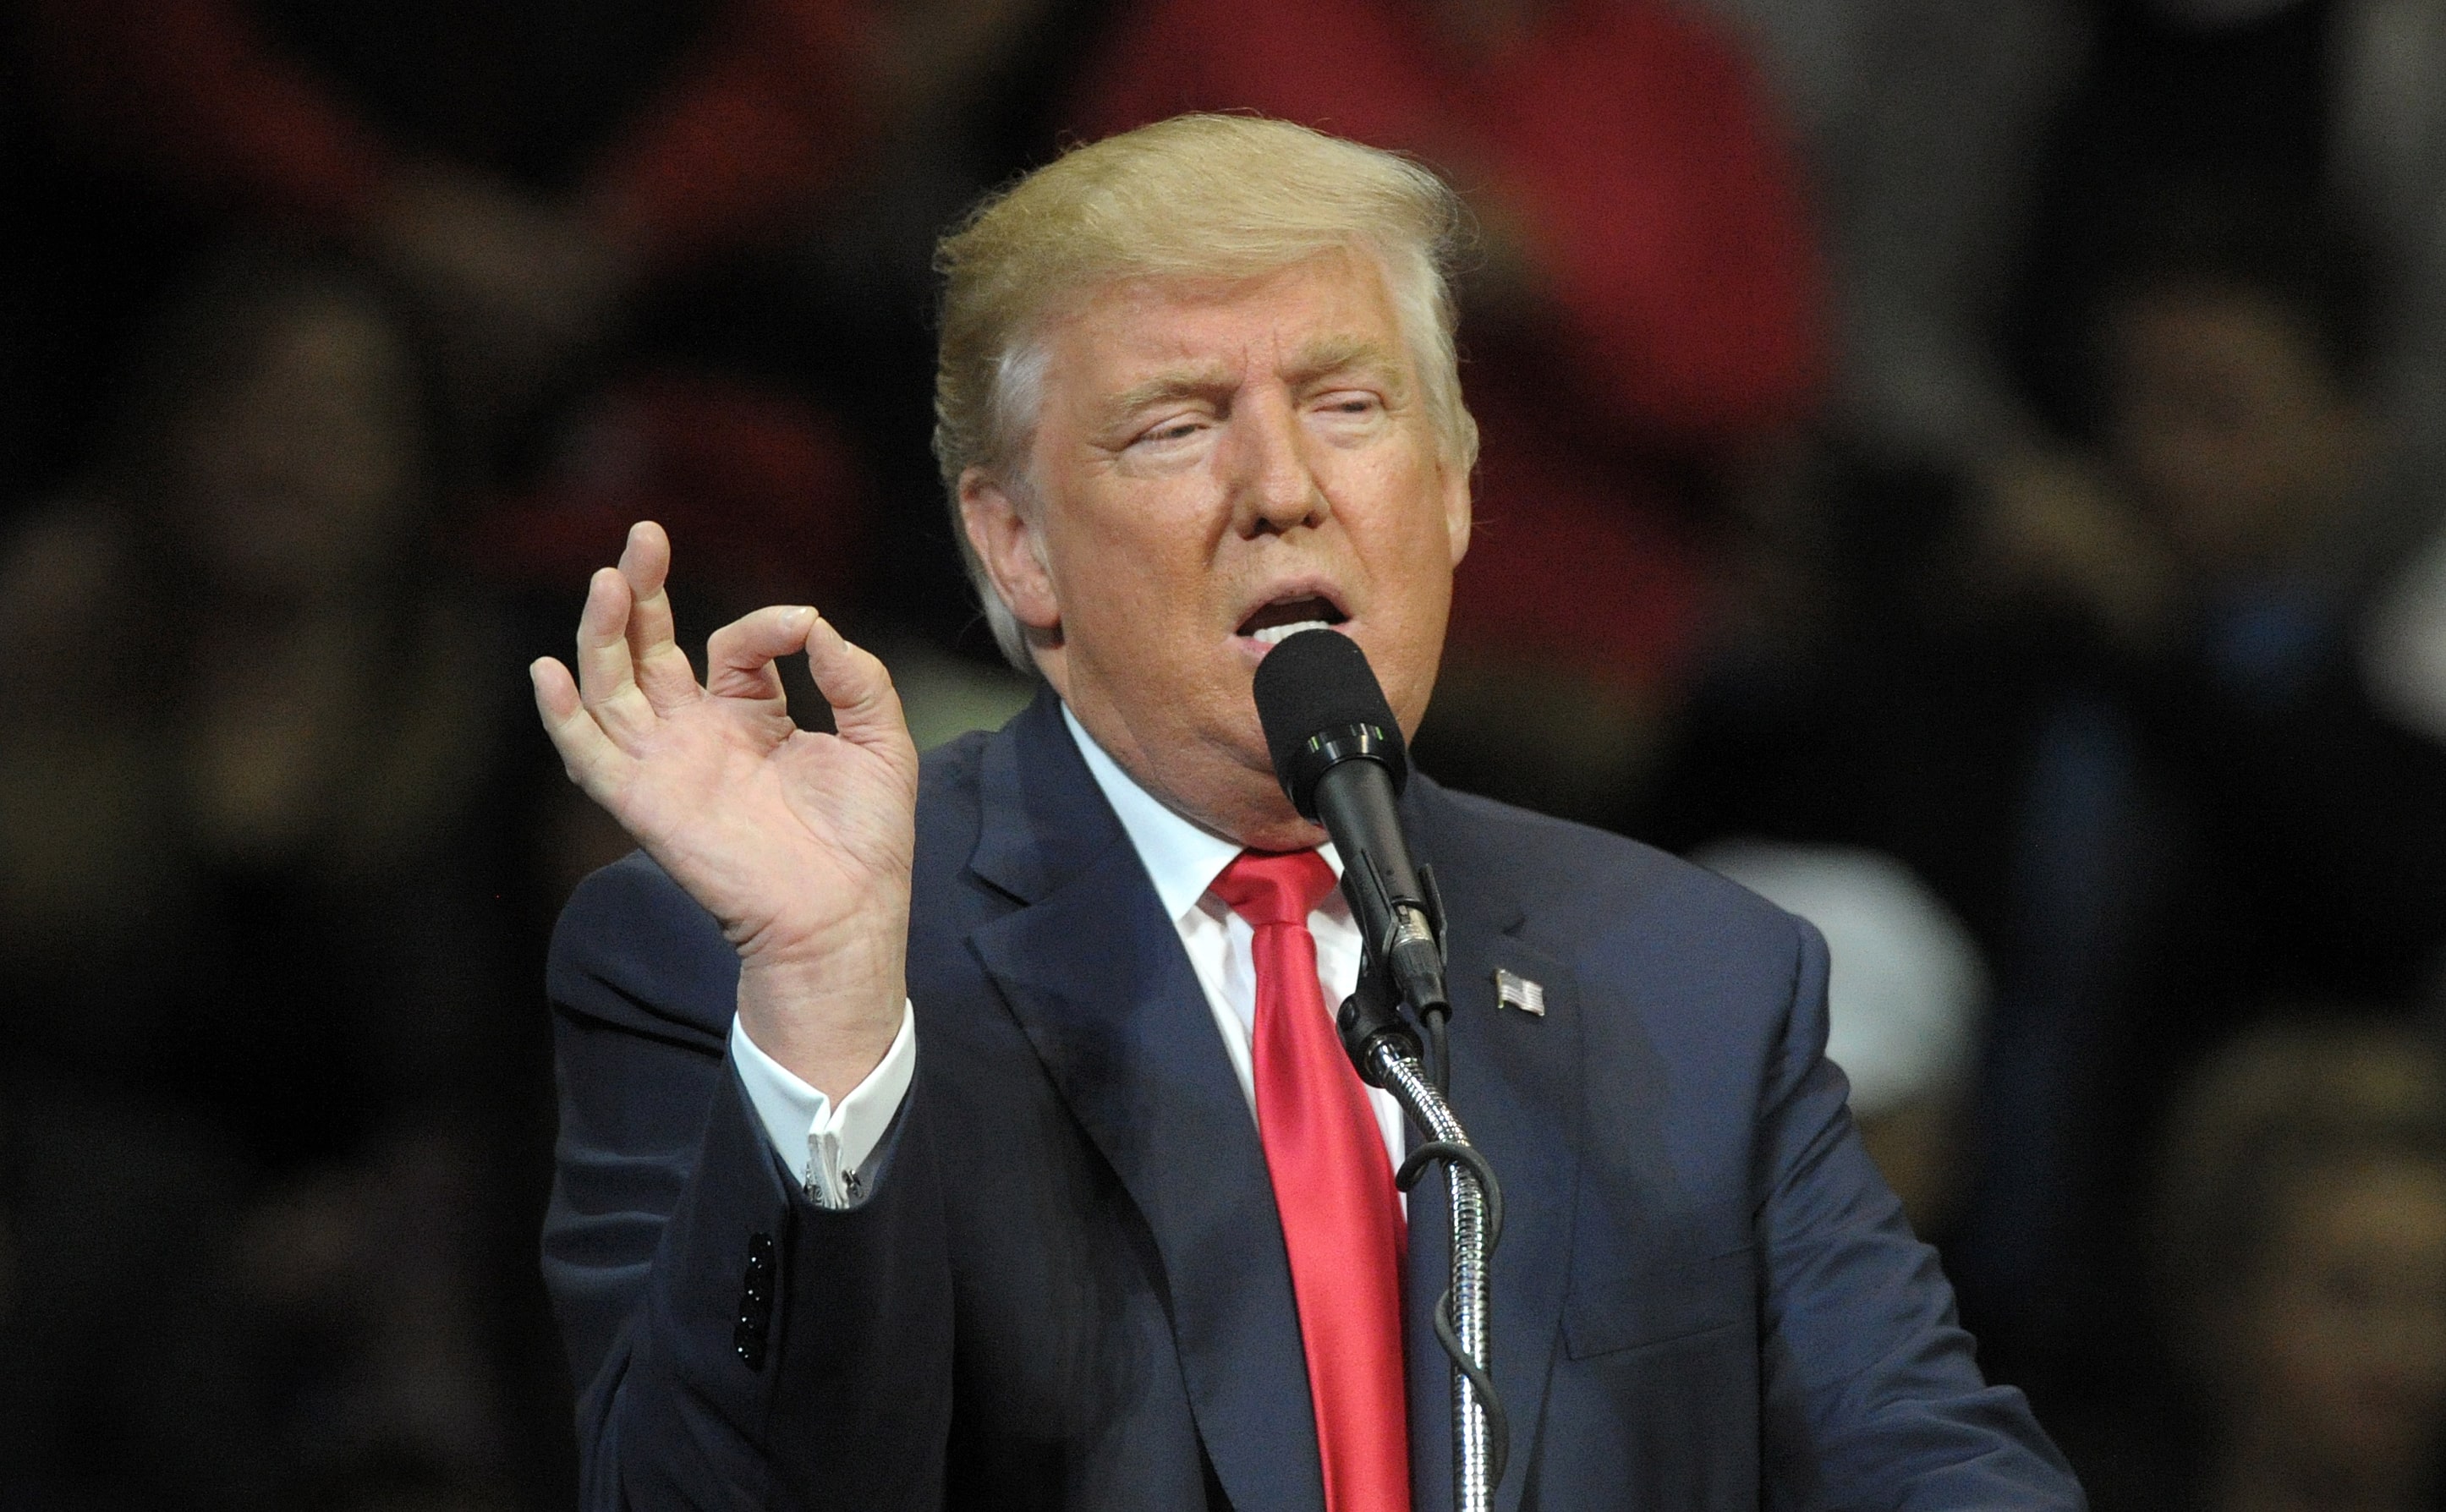
Donald Trump’s sweeping election victory is likely to put US-EU economic relations under pressure at a time when any remaining optimism on the eurozone growth’s outlook is fading fast. Still, we think the bloc has a few strategic advantages up its sleeve.
With Donald Trump soon making a return to the White House, the trade deficit with the EU is likely to come under renewed scrutiny. The President-elect has been vocal about what he perceives as unfair trade practices, particularly in the automotive and agricultural sectors. He has threatened to impose blanket tariffs ranging from 10% to 20% on all imports and to match tariffs raised by other countries to achieve a level playing field. But is the difference really that significant?
The differences in effective tariffs between the EU and the US
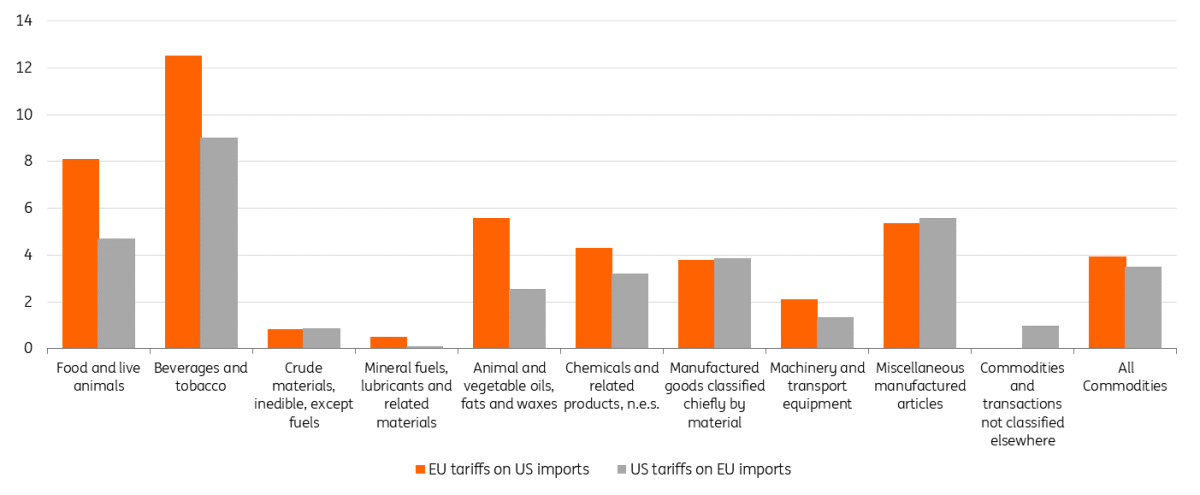
Effectively applied tariffs are not vastly different between the two countries, with the simple average standing at 3.95% for products from the US and 3.5% for EU products – but there are notable differences in certain sectors.
Trump has a point regarding tariffs on cars, agriculture, and food. For example, the EU tariff rate is 10% compared to 2.5% in the US for cars, and there is approximately a 3.5 percentage point difference for average tariffs on food and beverages. Additionally, tariffs on chemicals are on average 1ppt higher in the EU than in the US. However, the EU faces higher tariffs on commodities and transactions not classified elsewhere (miscellaneous or unspecified items) when exported to the US. Given this context, the EU might indeed face intense tariff threats and challenging negotiation rounds moving forward.
Effectively applied tariff rates on goods trade between the EU and the US (in %)
Source: WITS database for 2022, ING
The US is the EU’s top export partner
In 2023, the US emerged as the leading destination for EU exports, accounting for 19.7% of the EU’s total exports outside the bloc, followed by the UK at 13.1%. When it comes to imports, the US was the second-largest source (after China), providing 13.8% of the EU’s total extra-EU imports; China accounted for 20.6%.
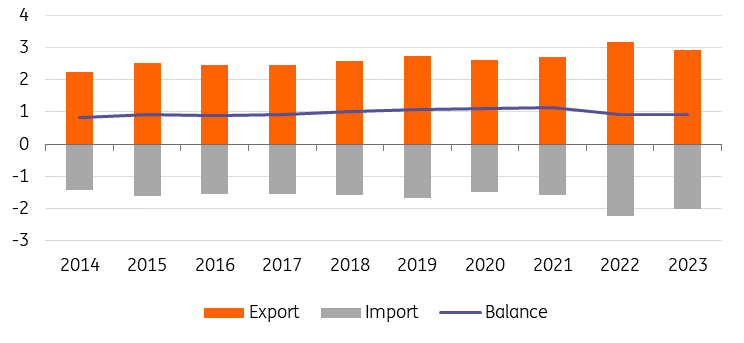
On balance, trade with the US has evolved positively for the EU over the last decade. It peaked in 2021 at 1.1% of the EU’s GDP, as seen in the chart below. Despite a slight decline from 2022 onwards – partly due to increased energy imports – the EU maintained the highest trade surplus with the US in goods trade, amounting to EUR156.7bn (0.9% of GDP) in 2023.
Evolution of EU goods trade with US as a % of GDP
Trade of the EU vis-a-vis the US (% of GDP)
Source: Eurostat, ING Research calculations
Ireland has the largest relative export exposure to the US
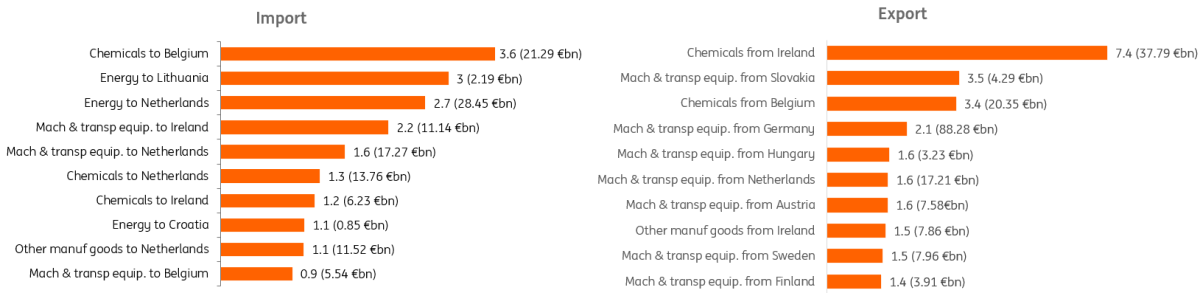
Not all EU policymakers need to be equally concerned about US trade dependencies, though. There are significant differences in trade exposure among member countries and sectors. Nations with strong chemical and pharmaceutical sectors, such as Ireland and Belgium, or robust machinery and transport sectors, like Slovakia and Germany, lead the way in terms of trade exposure. Ireland and Belgium's overall exports to the US are particularly high at 10.1% and 5.6% of their GDP respectively, compared to the overall EU export exposure of 2.9% of GDP.
On the import side, the Netherlands and Belgium, with their major Atlantic ports, import mainly energy and chemical products from the US. Their total imports are valued at 7.1% and 6.1% of their GDP respectively, compared to the overall EU import exposure of 2% of GDP.
Largest EU-US trade dependencies in 2023
EUs export & import flows to the US in 2023 (% of a county's GDP).
Source: Eurostat, ING Research calculations
US dependencies are large, but strategic dependencies balance in favour of the EU
Some EU countries therefore have more significant levels of exposure, particularly in the chemical and transport sectors – but the EU still holds an advantage. These exports include strategically important products, i.e., goods that cannot be easily replaced due to limited supply, high dependency from the importing countries, specialised production, and stringent quality requirements.
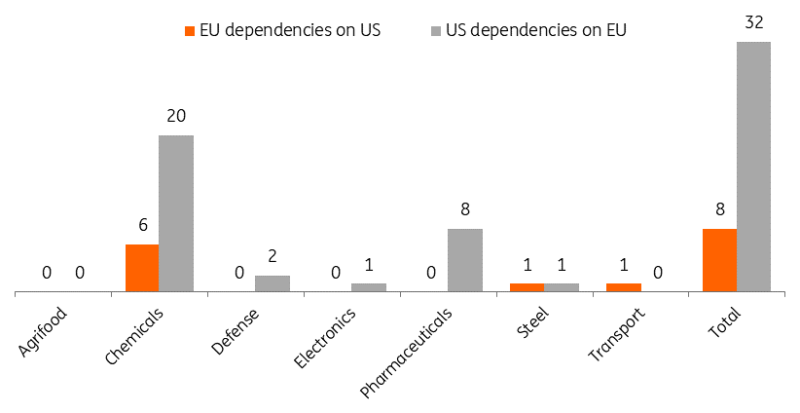
In 2022, the EU traded 122 strategically important products, representing 4.9% of its overall imports. Yet, the bloc is strategically dependent on the US only for eight products, six of which are chemicals (see the chart below). For instance, the EU relies heavily on beryllium (HS 811212), a metal classified as a Critical Raw Material by the European Commission. Beryllium is essential for defence, transportation, and energy applications. The EU sources 60% of its beryllium from the US, which holds the majority of global resources in a Utah mountain deposit, making substitution difficult.
The US, on the other hand, relies on the EU for 32 strategically important import products, mainly in the chemical and pharmaceutical sectors. This dependency balance favours the EU and will provide it with some leverage in negotiations with the incoming Trump administration.
Strategic interdependencies between the EU and the US
Source: Lefebvre and Wibaux (2024), data for 2022
Trump trade pressure and a potential response
It's no secret that Trump is disgruntled by the EU's trade surplus and has the region in his sights when considering additional tariffs. But the President-elect deems himself something of a dealmaker, and that could make it crucial for the EU to identify areas for concessions and deals. What are the EU’s options?
1. Europe could increase its purchase of US products, such as further boosting LNG imports. While the promise to ramp up LNG imports from the US was perceived as a gesture to appease Trump during his first term without the expectation of significant impact, the energy crisis has made those imports more valuable for the EU. In terms of defence, the EU could propose increasing its defence spending to 3% of GDP, with a commitment to purchasing more from US companies. Additionally, the EU could open up defence funding initiatives to non-EU companies, as is currently being discussed. Increasing those purchases might be an easy way to reduce the bilateral trade surplus to some extent. Buying more from the US is likely to be a key point in the upcoming trade negotiations.
2. The EU could target US products by imposing retaliatory tariffs. The Commission is said to have already prepared a list of goods which would be subject to additional tariffs.
3. The EU could use the Anti-Coercion Instrument (ACI), its “new weapon to protect trade” by launching countermeasures against a non-EU country if negotiations fail. These could include trade, investment or funding restrictions.
Regardless, the EU will go to the World Trade Organisation to prove its case. However, even though WTO panels have found US practices to be unfair and have authorised retaliatory measures in the past, these rulings have not resulted in significant changes. So, while we believe that the EU will try to stand up against Trump, this might be easier said than done. This is especially true given the differing interests of its member states, which were recently highlighted in the vote on additional tariffs on electric cars made in China.
A long-term threat to European economic growth?
What about the economic impact on Europe? Protectionism is generally bad news for economies, especially export-oriented ones. Yet long before tariffs come into effect, the uncertainty surrounding protectionist trade policy will have an economic impact on sentiment, potentially resulting in delayed investments and hiring.
In the longer term, this may strain trade relations between the EU and the US, further eroding the EU’s struggling manufacturing sector. And as we've written previously, Trump’s second term in office hits the European economy at a much less convenient moment than the first. Back in 2017, the European economy was relatively strong. This time around, it is experiencing anaemic growth and is struggling with a loss of competitiveness. A looming new trade war could push the eurozone economy from sluggish growth into recession. As a result, growth is expected to remain low in 2025 and 2026.
Read the original analysis: Why the EU still holds a Trump card in the face of rising trade tensions
Author

ING Global Economics Team
ING Economic and Financial Analysis
From Trump to trade, FX to Brexit, ING’s global economists have it covered. Go to ING.com/THINK to stay a step ahead.