Why technology is THE most important sector to watch for US investors

As we've noted before, US stocks are putting a bow on a stellar earnings season. At the start of the week, 95% of the companies in the S&P 500 had reported their Q1 earnings, with 75% of those companies beating EPS estimates and 64% beating revenue estimates (all earnings data courtesy ofFactSet's excellent "Earnings Insight" reports). On an aggregate basis, earnings rose fully 13.9% year-over-year, the strongest growth rate since Q3 2011. On a sector level, Q1 earnings growth was driven by pro-cyclical sectors like Energy (up $10B y/y), Financials (+19.9% y/y), Materials (+ 17.8% y/y), and Technology (+17.2% y/y).
At the risk of being trite however, the Q1 earnings results were generated over, you guessed it, the first quarter of the year. Rather than looking at past earnings results (especially relative to weak comparisons like energy in Q1 of last year), investors are always looking ahead to the future outlook for each sector of the US economy.
On a price action front, the outlook for the pro-cyclical sectors has been much more ominous. The chart below shows the performance of the major sector ETFs since the Fed's December meeting, when a number of established market trends shifted:
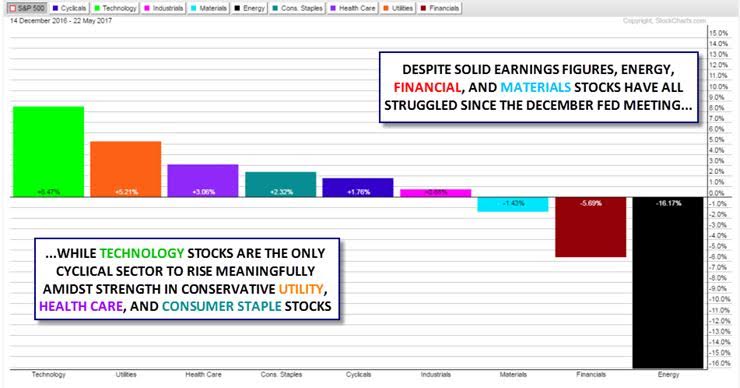
Source: Stockcharts.com
As you can see, technology stocks are the only cyclical sector rising amidst strength in traditional defensive sectors including Utilities, Health Care, and Consumer Staples (note that we wrote about the about some concerning signs in the energy sector earlier this month - see "Sector Showcase: XLE bears have all the energy" for more).
The recent price action prompts us to dust off our knowledge of sector rotation. For the uninitiated, sector rotation is the subset of technical analysis that involves evaluating what types of stocks are performing well to help predict how the stock market as a whole will perform moving forward. Historically, economically-sensitive sectors technology, material, and energy stocks tend to outperform the stock market in a healthy uptrend, while economically-insensitive sectors like utilities and health care stocks typically outperform when the market is at risk of a pullback.
Sam Stovall at CFRA developed the idealized sector rotation model shown below:
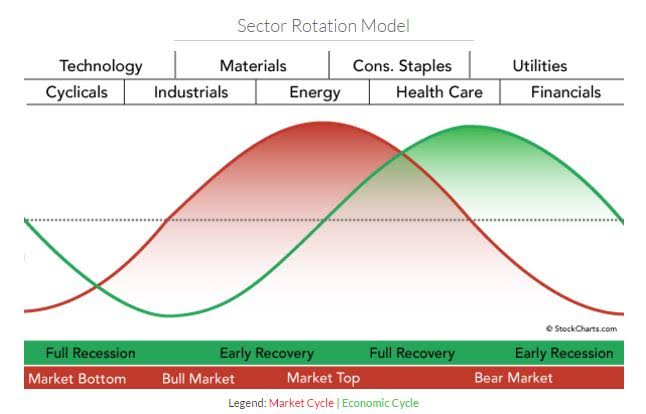
Source: Stockcharts.com
Given the solid "economic" (read: earnings) results from sectors like materials and energy this quarter, accompanied by disappointing price action in those same sectors, there is some risk that we're approaching the middle area of the chart above, the much dreaded "market top" stage.
Of course, no model is perfect, and the big outlier remains the technology sector. With massive tech firms like Apple (AAPL), Alphabet (GOOGL), Microsoft (MSFT), Amazon (AMZN), and Facebook (FB) filling out the ranks of the planet's most highly-valued stocks, it will be difficult for the overall market to roll over while tech stocks continue to outperform. As the relative strength (XLK/SPY) chart below shows, technology stocks remain in a healthy uptrend against the broader market:
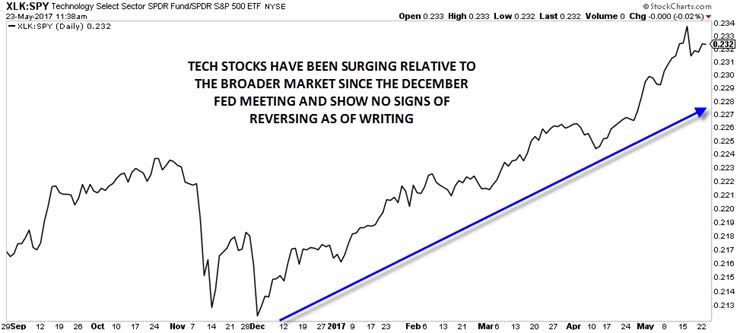
Source: Stockcharts.com
The bottom line is that, as long as the technology sector continues to power higher, the long-term uptrend in US stocks should continue. However, if we see tech stocks stumble in the coming weeks and months, it could portend the long-overdue pullback in US stocks that bears have been waiting for. You can bet we'll be keeping a particularly close eye on stocks like AAPL, GOOGL, MSFT, AMZN, and FB, as well as the tech sector ETF (XLK) moving forward.
Author

Matt Weller, CFA, CMT
Faraday Research
Matthew is a former Senior Market Analyst at Forex.com whose research is regularly quoted in The Wall Street Journal, Bloomberg and Reuters. Based in the US, Matthew provides live trading recommendations during US market hours, c


