Why is stagflation bad for equities and bonds alike
Outlook: As expected, US house prices are scary high, with the Case-Shiller up 19.7% y/y as of August and new home sales soaring at a 14% annual rate. Conference Board consumer confidence rose after three months of decline, to 113.8 from 109.8 in September. “Present situation” rose to 147.4 from 144.3 last month. “Expectations” also rose to 91.3 from 86.7. Even the Richmond Fed manufacturing index rose to 12 from -3 when a lesser gain to 5 had been forecast.
This data points to a perfectly acceptable level of activity and not “stagnation” but forecasts of a lousy GDP number tomorrow continue to haunt. By now everyone is citing the Atlanta Fed’s 0.5%. Reuters has 2.7% and the consensus is given as 3.2%. Today we still have durables to go, with durables ex-transportation up 0.4% (from 0.3%) and non-defense capital goods up 0.5% when it was 0.6% last time–but the headline number at -1.1% vs. +1.8%, and headlines can scare the horses, even though the drop would be due entirely to airplane orders. You’d think we’d all know that by now.
While we have robust numbers in some places and falling numbers in some others, it all boils down to a gloomy outlook that is not justified by all the data. The public imagination has been shanghaied by talk of stagflation, becoming more popular by the day. Reuters reports Google searches for the word “stagflation” will probably hit the highest level since 2008 and Goldman Sachs notes the term is the most common word in conversations with clients. The latest BoA/ML fund manager survey has 14% expecting stagflation.
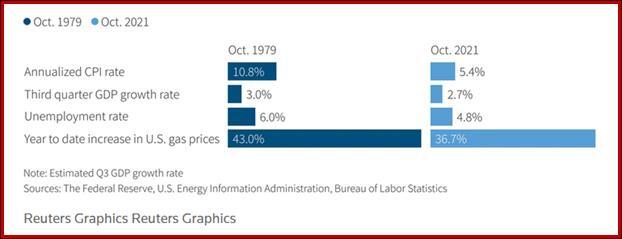
Stagflation is bad for equities and bonds alike (due to the inflation effect). See the comparison with 1979. “Gas prices” refers to gasoline for cars, by the way. This is a dreadfully misleading table. In the late 1970s, we had more of a manufacturing economy that was just starting to morph into a services economy. Even so, remember last week’s PMI for manufacturing that showed recovery, a rise to 61.1 in Sept for the second month and beating forecasts. Trading Economics reported, “The latest reading signaled one of the strongest rates of expansion since 1983, boosted by solid increases in production (59.4 vs 60.0 in August) and new orders (66.7, the same as in August), as well as a slight rebound in employment levels (50.2 vs 49.0).”
In the 1970s, we also had an entirely different set of factors we all looked at–M2 money supply at the top of the list. M2 became so toxic the Fed doesn’t even report it the same way anymore. We also had the trade deficit as a far bigger factor for currencies; today it barely gets noticed now that capital flows are the driver. Mostly we had a Fed that failed to issue clear and transparent rules of the road–until Paul Volcker came along. By late 1979, Fed funds were hitting 20% and that fixed the panic in short order. We were on loan from the FX desk to the Fed funds desk while all this was going on and we remember it well. Remember we were still reeling from the 1973 and 1979 oil price shocks–definitely not so today.
The differences between the 1970s and today are both structural and institutional. Again we have to emphasize that you can’t charge “stagnation” when so many factors are clearly showing only a temporary slowdown and the cause of that slowdown too obvious for words–the pandemic.
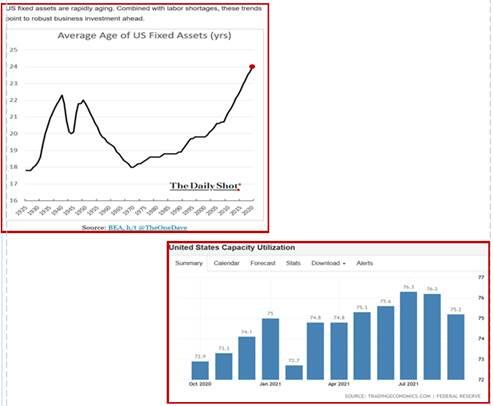
On the other side of the argument–that growth will bust out in song any minute–is just as inappropriate and wrong. The Daily Shot comes through with another jaw-dropper of a chart, this one showing the antiquated fixed capital base that is the oldest ever, 24 years. The commentary says that given the labor shortage, this means the capital investment will be soaring to replace the old stuff. Well, not necessarily. A lot of that old stuff is abandoned factories, warehouses, docks, homes and apartment blocks, and even shopping centers that will never, ever be brought back. Remember the Rust Belt photos of the 1980s and Detroit houses today. Who says they will be rebuilt and replaced? Today we have (for example) supermarkets being closed in California. (Golly, maybe that space can be used to house the homeless.)
This brings us to another issue, the so-called output gap, or potential GDP vs. actual GDP. This gives every Econ 101 student a stomachache, and if they are honest, the professors, too. The core idea is that an economy has an optimum output at peak efficiency, and peak efficiency means hardly any unemployment. If the actual reported data is above that number, it means demand is outstripping supply and inflation looms. If the data is below that number, the central bank should goose the economy.
How do you know optimum output? There is literally no way to know it. Economists being economists, estimate it using historical data, as though that would work. One place where it might work is factory capacity utilization. That’s a number that can be garnered from the field. Even the St. Louis Fed likes this one, although it admits that “full capacity” makes assumptions about efficiency that are not actually known (read the footnotes). When capacity utilization is 80% or more, inflation can be the outcome. (This was one of the deductions from the experience of the 1970s, when utilization was high (90%) and inflation soared.) When it’s down around 70-75%, inflation is not an issue because there is excess capacity and therefore, it’s presumed, supply can easily catch up to demand
Well, no. Capacity utilization can be low, as it is now at around 75%, because of authentic input shortages and/or labor shortages, with no promise or need for anyone building additional new capacity or replacing the old stuff. Bottom line, the chart showing antiquated capital assets that “should” get revived, is 100% wishful thinking. Even in the most fairy-dust covered economic model, there is no promise of capital spending to revive and replace, especially with the capacity to spare in existing facilities.
We judge the ancient fixed asset base as not promoting what the authors intended–a surge in fixed asset capital investment. In fact, the only party talking about new non-residential fixed investment is the Biden administration. Just try to get a handle on Capex, meaning non-residential fixed asset capital spending plans of major corporations. We tried a search and found only that Amazon is building and oil companies are cutting back hard. (In Japan, the Tankan asks for and gets the data on capital spending plans.) One ray of light–a fair amount of capital is going to things not counted as hard assets, specifically software. It’s still an investment, it’s still a contributor to capacity, it still employs people, and it makes for higher efficiency.
Bottom line, we need to compare current data to pre-pandemic data and never, ever to data from decades-long past when entirely different structural and institutional norms ruled. Just one more example–we didn’t have PCs in 1979. Yes, we typed stuff on typewriters with carbon paper. We didn’t have the internet. We didn’t have cellphones and we barely had cable TV. We refuse to buy any comparisons to 1979.
And finally, that brings us back to the dollar “smile.” The dollar gains when growth looks good and the Fed looks hawkish. It also gains when gloom descends and risk looks high. We believe the growth/hawkish story is the right one this time. Yields “should” go up and the dollar with them.
This is an excerpt from “The Rockefeller Morning Briefing,” which is far larger (about 10 pages). The Briefing has been published every day for over 25 years and represents experienced analysis and insight. The report offers deep background and is not intended to guide FX trading. Rockefeller produces other reports (in spot and futures) for trading purposes.
To get a two-week trial of the full reports plus traders advice for only $3.95. Click here!
Author

Barbara Rockefeller
Rockefeller Treasury Services, Inc.
Experience Before founding Rockefeller Treasury, Barbara worked at Citibank and other banks as a risk manager, new product developer (Cititrend), FX trader, advisor and loan officer. Miss Rockefeller is engaged to perform FX-relat


