Where does the wave end? Volume profile and VWAP on ES, Oil and Euro [Video]
![Where does the wave end? Volume profile and VWAP on ES, Oil and Euro [Video]](https://editorial.fxsstatic.com/images/i/eur-usd-fix-02.jpg)
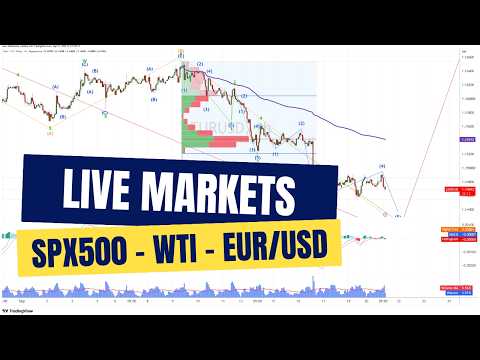
"How do I find the end of the wave?" It's the question I get more than any other, and for good reason: the Elliott Wave count tells you what's coming, but not where it ends. For that, you need another tool. In this breakdown we apply Volume Profile and VWAP to three live markets — S&P futures, crude oil, and EUR/USD — to turn that question into a concrete target zone.
In short: the ES is approaching the 7,800 area on thinning volume, signaling distribution ahead. Oil completed five waves down with a MACD divergence and volume drying up at the lows, targeting a bounce toward 98–100. And the euro is finishing Wave 4, with a fresh low and rejection expected before the move back to the point of control.
What the video shows
ES: volume thins out before distribution
On S&P futures we use two volume profiles. The first, from the previous high to the low, shows the distribution of the prior cycle — and that zone was the target when the last leg ended. The second, over the current cycle, reveals something important: at the current price, volume is thin. It's slowing down.
Price rising on thin volume is fragile ground. It tells us distribution is about to happen. Price can travel a little higher, into and above the 7,800 area, but once we see the signs of the turn — choppy price, MACD divergence, lost momentum — we'll know price is heading back to the point of control of the previous profile.
The VWAP anchored from the low sits at the same level as that point of control. That confluence is the target zone for Wave 2. Once we get there, we decide: keep the bullish bias, or come back to the low.
Oil: five waves, divergence, and exhaustion
Crude oil sold off sharply from the 106–107 area down to 91. Four elements align at the low: a completed five-wave structure, a MACD divergence, volume easing off at the bottom, and price trading far from its VWAP.
The volume reading is basic supply and demand. Most of the volume traded on the upper side of the move; at lower prices, supply shrinks and demand starts to increase. Put those elements together and the setup points to a bounce back toward the 98–100 area.
Euro: the end of Wave 4
On EUR/USD, this morning in our trading room we were focused on finding the end of Wave 4 to follow the leg down into Wave 5, back toward the previous lows. The expected setup: a fresh low, a rejection, and a significant retracement toward the point of control.
The important nuance: we're following the trend for now, but at that low we need to be extra careful. A strong breakdown is less likely than a rejection.
What the video didn't cover
Why Volume Profile beats Fibonacci for targets
Fibonacci gives you mathematical levels: 38.2%, 50%, 61.8%. But it doesn't tell you which one the market will respect. Volume Profile tells you where trading actually happened — where participants are, and therefore where their stops sit. It's information about what occurred, not a theoretical ratio.
That said, the highest precision doesn't come from replacing one tool with another. It comes from finding the cluster: the zone where the Volume Profile point of control, the VWAP, and a Fibonacci level overlap. When three independent references point to the same place, the probability that it's the real target rises considerably.
Don't anticipate two waves ahead
A common mistake among Elliott Wave analysts is projecting Waves 3, 4, and 5 while Wave 2 hasn't finished. That creates bias and rigid counts the market rarely respects.
The better approach is to travel from point to point. Know the immediate target, wait for price to get there, and when it arrives, validate: is price arriving with strength or weakness? Is volume confirming or diverging? Only then do you decide whether the cycle continues or reverses. Validation happens at every point, not once at the start.
Volume in forex is reliable
The euro trades in a decentralized market with no central volume report. That's why we use tick volume, which tracks real volume closely enough to identify where activity concentrates and where the point of control sits. The technique works the same on futures, forex, or any other market.
The core idea
The Elliott Wave count tells you which wave is coming. Volume Profile and VWAP tell you where it ends. Combined, they turn the most common question in wave analysis into a verifiable target zone — and let you arrive at each point with a plan, then evaluate with data before making the next decision.
This is what we work through every morning in our trading
Author

Juan Maldonado
Elliott Wave Street
Juan Maldonado has a University degree in Finance, and Foreign trade started his trading career in 2008. Since 2010 has been analyzing the markets using Elliott Wave with different strategies to spot high probability trades.















