Gold, Silver, and the $6 Diesel the Fed sees that WTI doesn't show

Two comments arrived on Friday that deserve answers in the Alert rather than in the thread, because both are right about the facts and one of them is wrong about the conclusion.
The first: that I might be missing what is going on with diesel, that it is a supply problem, and that as long as it is, the printed WTI futures price does not mean anything.
The second: the metals are up because the dot plot put the 2027 rate where the 2026 rate ends and pushed the return to 2 percent inflation out to 2029, so the 25 basis points delivered do not matter and the next 25 do not either.
Both get a table.
Diesel is the channel
The point from the first question is right, and it strengthens the case rather than weakening it.
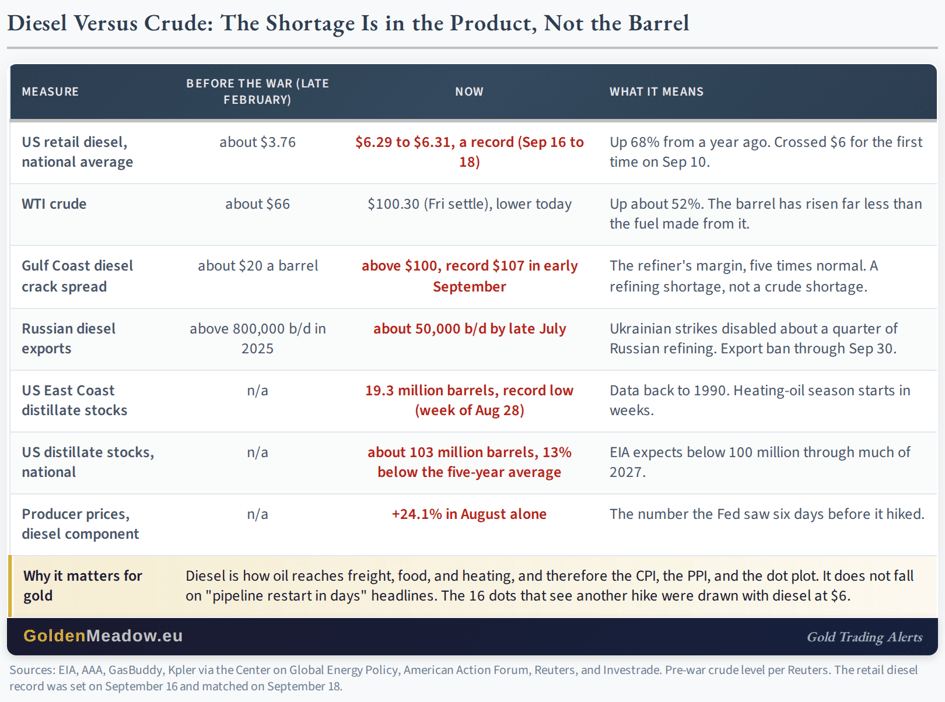
US retail diesel set a record of $6.31 on September 16 and matched it on Friday, up 68 percent from a year ago and from about $3.76 before the war. Crude is up about 52 percent over the same period.
The difference is the crack spread, the refiner's margin between the barrel and the fuel, which sits above $100 against a normal $20 to $40. That is the signature of a refining shortage, not a crude shortage: Hormuz took Middle Eastern product exports off the market, Ukrainian strikes disabled about a quarter of Russia's refining and collapsed its diesel exports from more than 800,000 barrels a day to about 50,000, and US East Coast distillate stocks are at a record low with the heating season weeks away.
The president said on September 14 that the diesel price rise "is mostly caused by the Russia/Ukraine War, not Iran," which is a way of saying that two supply shocks are compounding and neither is under his control.
Here is why it matters for us. Diesel is how oil reaches the economy: freight, farming, construction, and heating. It is the reason the August PPI showed diesel up 24.1 percent in a month and goods prices up 1.1 percent, and it is the number the Fed saw six days before it hiked with 16 dots pointing higher. WTI falls on a "pipeline restart in days" headline, and it has, four sessions running. Diesel does not, because the shortage is in refining capacity that no pipeline fixes. So the reader's point that the WTI print "doesn't mean anything" is right in one specific sense: it means less than diesel for the inflation data, the dot plot, and the two-year yield, and those are the things that set gold's price.
One footnote for the tape: the 7 percent decline in WTI on my screen is mostly the contract roll, not the move. The October contract, which settled Friday at $100.30, expires tomorrow and trades near $98, and the quote has switched to November, which trades near $93.50 in this backwardated market, about $5 below October. Measured against its own Friday level, November is down about 2 percent, in line with Brent near $102. From here, $93.50 is the WTI number readers will see, and the $7 gap from Friday's headline is the spread between two contracts, not a collapse.
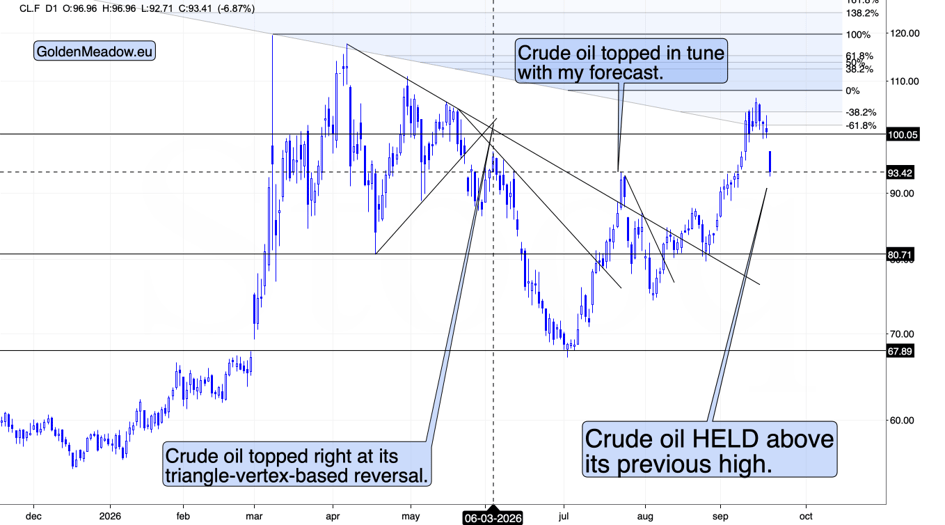
Technically, crude oil futures (the above chart features the continuous futures contract) touched the previous high and moved slightly back up. This could simply be a verification of the breakout above this high.
The dot plot, read two ways
The second question has the numbers right. The median federal funds rate for the end of 2027 is 4.1 percent, the same as the end of 2026, and the projections do not show inflation back at 2 percent until 2029. Here is the full grid, with one column added.
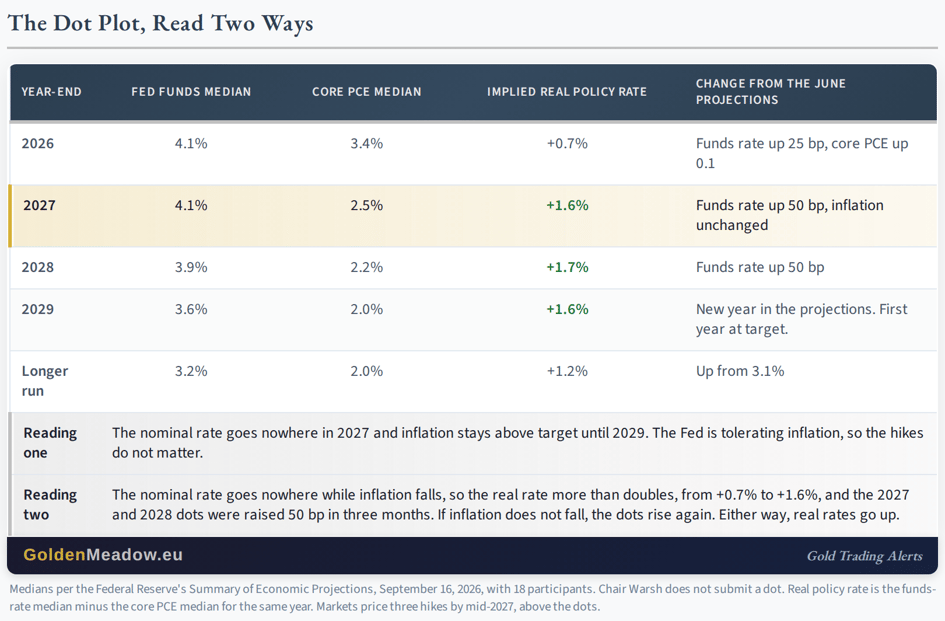
The added column is the real policy rate, the funds rate minus the Fed's own inflation projection for the same year. It rises from 0.7 percent this year to 1.6 percent in 2027 and 1.7 percent in 2028. That is what a flat nominal path does when inflation is projected to fall: it tightens in real terms without a single further hike. A funds rate that goes nowhere while core PCE goes from 3.4 to 2.5 is a real rate that more than doubles, and gold's price is set by real rates, not by the count of hikes.
There is a second branch, and it is the one the reader is implicitly betting on: inflation does not fall. In that case the dots move, as they did in September, when the 2027 and 2028 medians were raised 50 basis points in three months on a 0.1-point upward revision to inflation. The market has already priced that branch, with three hikes expected by mid-2027 against the dots' one. So the two readings resolve the same way. Either inflation falls and real rates rise, or inflation stays and nominal rates rise.
Neither is the "Fed tolerates inflation" story that would make the metals go up, and the metals have not gone up: gold settled Friday $37 above its pre-Fed level and has given that back this morning.
The reader's last line, "at this time," is the honest part. At this time, the hike does not matter to a metal that has spent two weeks inside a $140 range. It will matter the way the last two hikes mattered in June and July, when the metal broke the range in the direction of the real rate.
Gold: Back to the pre-Fed level
Gold settled Friday at $4,424.90, up $25.20, and silver at $67.15, up $1.05, which made Friday the sixth session in ten in which silver led the upside. On Friday I wrote that silver was "clearly outperforming here" and asked readers to remember September 9.
This morning gold is down about $36 to near $4,389, silver is pretty much flat, and the 10-year note is bid
That last detail is the one to hold onto: gold is falling with yields falling and the dollar flat, which means it has no bid of its own on a day when both of its drivers are pointed the right way. Every dollar of Friday's gain is gone, and the metal sits within two dollars of where it settled before the Fed spoke.
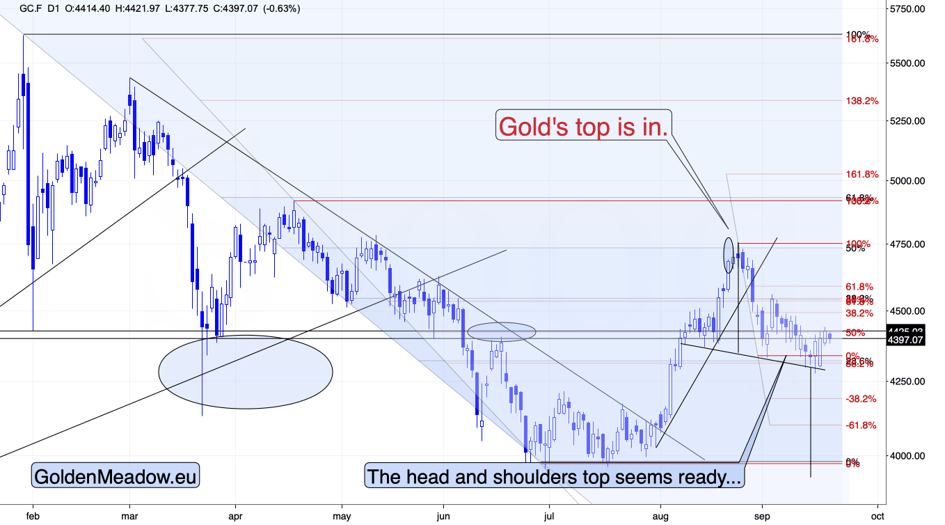
Technically, this chart is… what we all know it is. It’s boring.
It’s been featuring the same thing for a few weeks now.
Back and forth movement around $4,400.
After declining from $4,750 and creating a head-and-shoulders formation, where a second right shoulder seems to be forming.
It’s the middle of the trading range that we’ve seen gold in since late March – between $4,000 and $5,000.
Will it really decline from here? Yes, that continues to be the most likely outcome. The USD Index is back above 100.
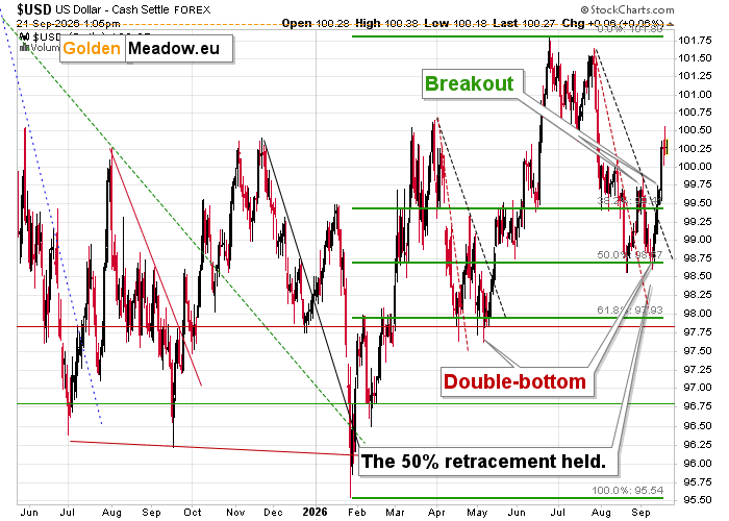
Today will probably be the third daily close in a row with the USDX above 100 – which means that the comeback will be confirmed.
Remember what happened in late June, when we saw the rally from those levels way above 101? Gold price declined from approximately the current levels to about $4,000.
This can – and is likely to – happen again.
What happens then? Perhaps the USD Index – and gold – will take a breather and then move further. The USD Index – up, and gold – down.
Will this happen shortly? It might. It might not as the consolidation in gold could take another week. Given USD’s breakout that’s likely to be confirmed today, it seems that we might not need to wait for long, but nobody – myself included – can guarantee that.
Want free follow-ups to the above article and details not available to 99%+ investors? Sign up to our free newsletter today!
Author

Przemyslaw Radomski, CFA
Gold Price Forecast
Przemyslaw Radomski, CFA (PR) is a precious metals investor and analyst who takes advantage of the emotionality on the markets, and invites you to do the same. His company, Sunshine Profits, publishes analytical software that any















