When the bigger picture starts speaking
A new month always offers traders something unique - a fresh set of monthly candles.
While daily charts help us navigate short-term price action, monthly charts often reveal the bigger story hidden beneath the day-to-day noise. That's exactly what we're introducing in today's Lab.
From now on, every monthly edition will include two perspectives:
• Daily View -> focusing on the current market structure and the most important levels for the coming sessions.
• Zooming Out -> stepping back to evaluate what the latest monthly close tells us about the broader trend and the opportunities that may unfold over the coming weeks.
Because successful trading isn't just about knowing what's happening today... It's about understanding where today's move fits into the bigger picture.
Market Context
June came to an end with several important technical developments across the markets. While some instruments confirmed earlier breakouts, others spent the final trading sessions trapped inside consolidation ranges, leaving traders waiting for the next decisive move.
Now, as we enter a brand-new month, the focus naturally shifts from individual daily candles to the message left behind by June's monthly close. Monthly charts won't tell us what will happen tomorrow, but they often reveal whether the broader trend is quietly strengthening, weakening, or preparing for a much larger move.
That's why today's Lab combines both perspectives: the short-term roadmap for active traders and the bigger-picture outlook that could shape the weeks ahead.
Dollar Index (DX.F)
Daily View
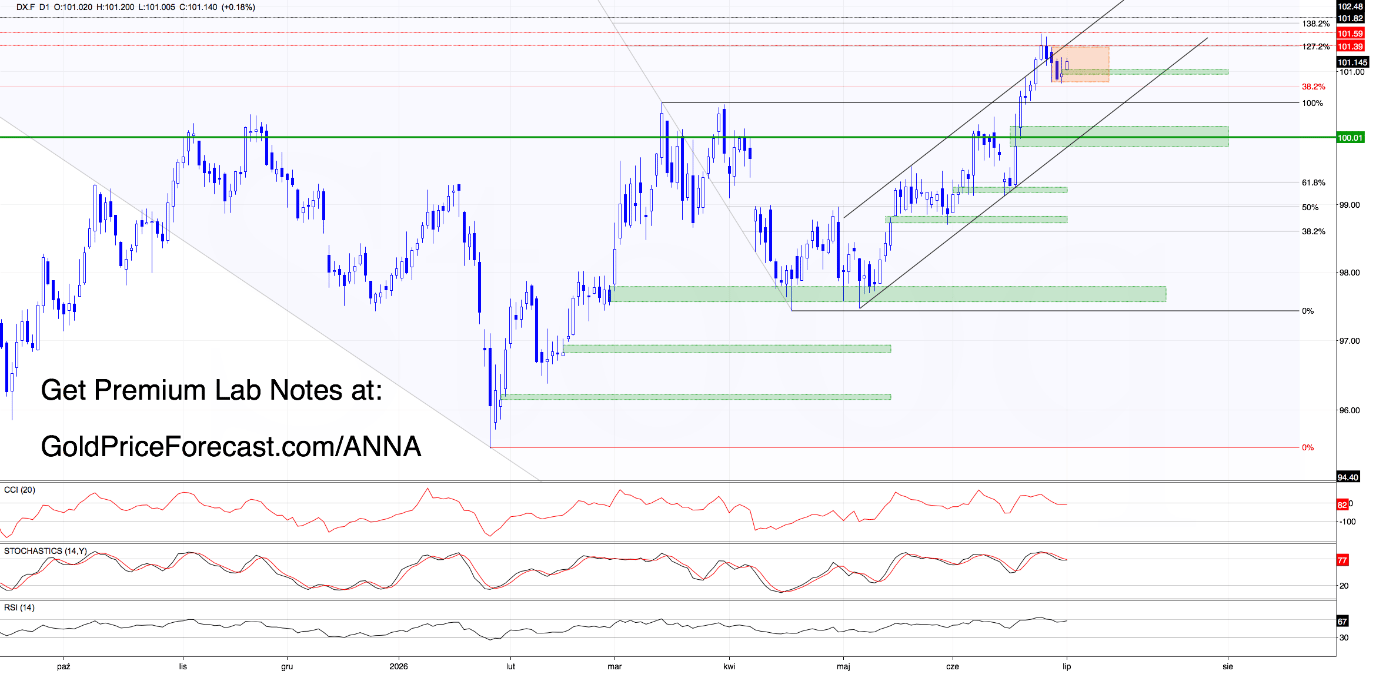
Looking at the daily chart, the first thing that stands out is how buyers managed to defend the previously broken 38.2% Fibonacci retracement despite several recent downside attempts.
In fact, bears had three separate opportunities to push the market lower but failed every single time.
That resilience triggered a bullish gap between 100.96-101.02 at the start of today's Asian session, and buyers continued building on that momentum during the following hours.
Does that mean the correction is over?
Not necessarily.
The Dollar Index is still trading inside an orange consolidation zone between 101.13 and 101.36, which means the next meaningful move will likely begin only after price successfully breaks out of that range.
That said, based on the latest price action, a test of both the upper boundary of the consolidation and the upper boundary of the black rising channel appears to be the higher-probability scenario in the coming hours.
This is where the real battle begins.
If buyers win, the next upside target will likely be the next resistance zone we discussed back on June 25:
“(…) buyers remain in control and still have a chance to attack the next upside target around 101.74-101.81, where the 138.2% Fibonacci extension and the May 2025 intraday high come into play.(…)”
If they fail, today's move would simply become a textbook retest of the earlier breakdown below the upper boundary of the rising channel.
In that scenario, today's bullish gap (100.96-101.02) would become the first technical support for the bears to challenge.
Daily Takeaway
• Watch the 101.13-101.36 consolidation.
• No breakout = no trade.
• Break above 101.36 -> opens the door toward 101.74-101.81
• Rejection from the upper boundary -> favors a verification of the earlier breakdown below the rising channel.
• Today's bullish gap (100.96-101.02) now serves as the first key support.
Zooming Out
Now let's zoom out and see what June's price action tells us from a longer-term perspective.
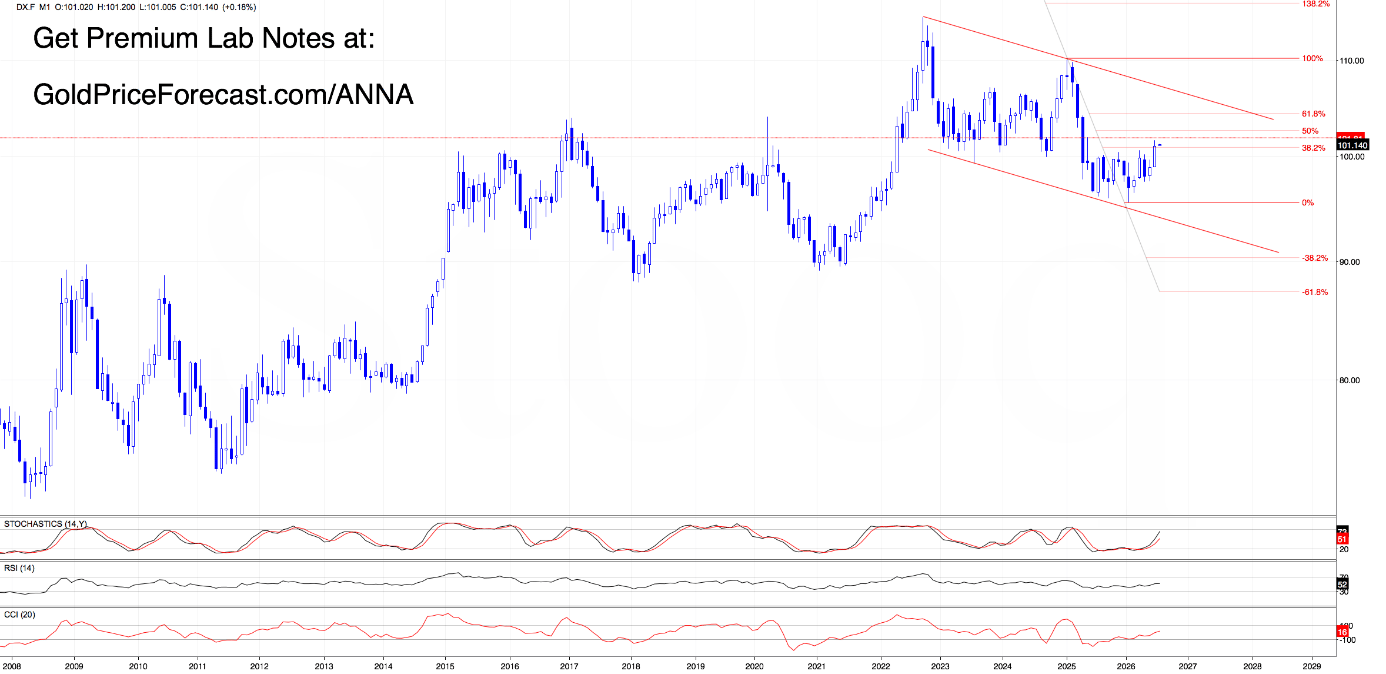
The monthly chart delivered an encouraging signal for dollar bulls.
Despite several pullbacks throughout June, the Dollar Index finished the month above the 38.2% Fibonacci retracement, suggesting that the broader recovery remains intact.
As long as that monthly breakout holds, the next major upside target continues to be the May 2025 high at 101.81.
If buyers manage to clear that barrier, the next long-term upside target will likely be around 102.55, where the 50% Fibonacci retracement of the entire January 2025-January 2026 decline is located.
In other words, while the daily chart is still asking whether buyers can win the current battle...the monthly chart suggests the broader campaign is far from over.
Long-Term Takeaway
• June closed above the 38.2% Fibonacci retracement.
• Long-term outlook remains constructive while that breakout holds.
• 101.81 remains the next major upside target.
• Break above 101.81 -> opens room toward 102.55 (50% Fibonacci retracement).
• The monthly trend continues to favor buyers despite the current short-term consolidation.
Palladium (PA.F)
Daily View
Let's begin with a quote from June 26 before moving to today's update:
“(…) Even more importantly, yesterday's small bullish gap (1174.90-1182) remains open, suggesting buyers may attempt another push toward Wednesday's bearish gap between 1238-1243.90.(…)”
Looking at today's chart, we can see that price has continued following the roadmap we outlined in Friday's analysis almost perfectly, with buyers successfully reaching our previously discussed upside target.
So... is everything turning bullish?
Not quite.
On the positive side, palladium has shown noticeably more determination than the other metals we've covered so far. Buyers clearly stepped up and proved they're still willing to fight.
The problem?
Despite that recovery, the market still finished the day below last week's bearish gap between 1238-1243.90. In other words, buyers are trying, but they still haven't delivered the confirmation the market needs.
Today's pullback extended losses and brought the price back to test the upper boundary of the small bullish gap from June 25 (1174.90-1182).
So, what happens next?
As long as that bullish gap remains open, buyers stay in the game and still have another opportunity to challenge the first major resistance zone.
That said, we shouldn't forget the bigger short-term picture.
Just like the other precious metals, palladium continues trading inside the orange consolidation. Until price delivers a confirmed breakout - or breakdown - from that range, expecting larger directional moves may be premature.
For now, short-term swings in both directions should come as no surprise.
Daily Takeaway
• Watch the 1174.90-1182 bullish gap.
• As long as that gap remains open, buyers retain a chance to continue the recovery.
• First major obstacle remains the 1238-1243.90 bearish gap.
• No breakout/breakdown from the current consolidation = no meaningful trend.
• Until then, expect continued two-way price action inside the range.
Zooming Out
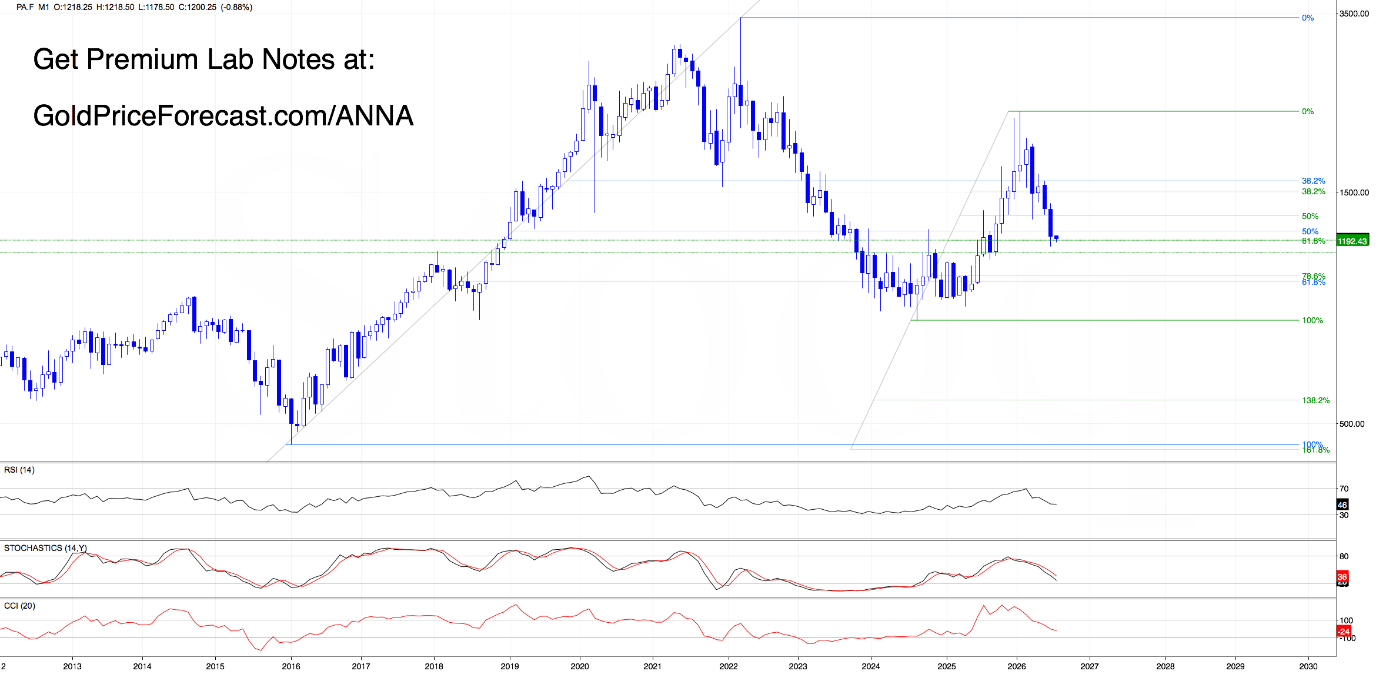
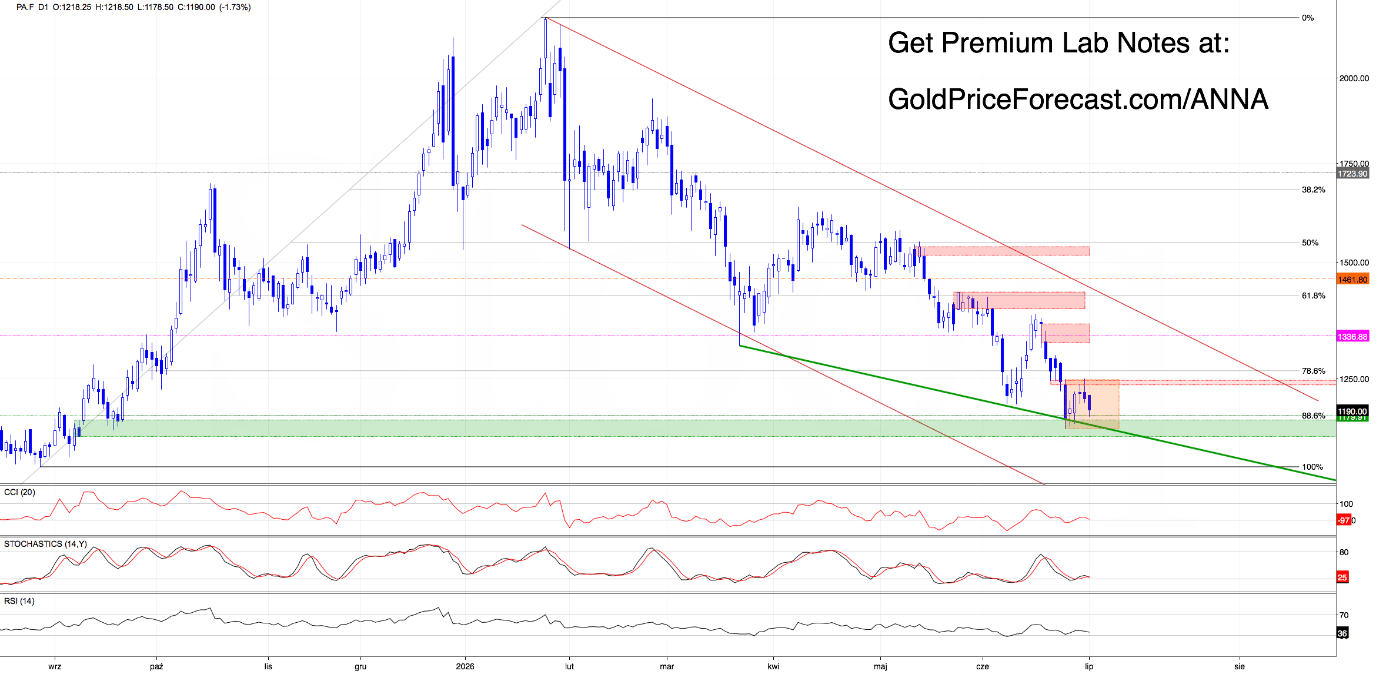
The monthly chart offers a much more encouraging picture.
Although June's bearish candle pushed palladium down to the 61.8% Fibonacci retracement, buyers managed to invalidate the earlier breakdown below this key support before the month came to an end. That's an important technical development.
Instead of confirming a larger bearish continuation, the market reclaimed one of its most important long-term support levels.
In our opinion, as long as palladium continues holding above that reclaimed support, the path toward the next major support zone around 1125 remains blocked, giving buyers a solid technical foundation to build on over the coming weeks.
The next major objective is already well defined.
A daily close above 1244 would become the first meaningful confirmation that buyers are regaining control and are ready to challenge higher levels.
• Long-Term Takeaway
• June ended with an invalidation of the earlier breakdown below the 61.8% Fibonacci retracement.
• Reclaiming that support significantly improves the longer-term technical picture.
• As long as price holds above that level, the next major support around 1125 remains protected.
• Buyers now have a solid technical foundation for a broader recovery.
• The first major long-term confirmation comes with a daily close above 1244.
Copper (HG.F)
Daily View
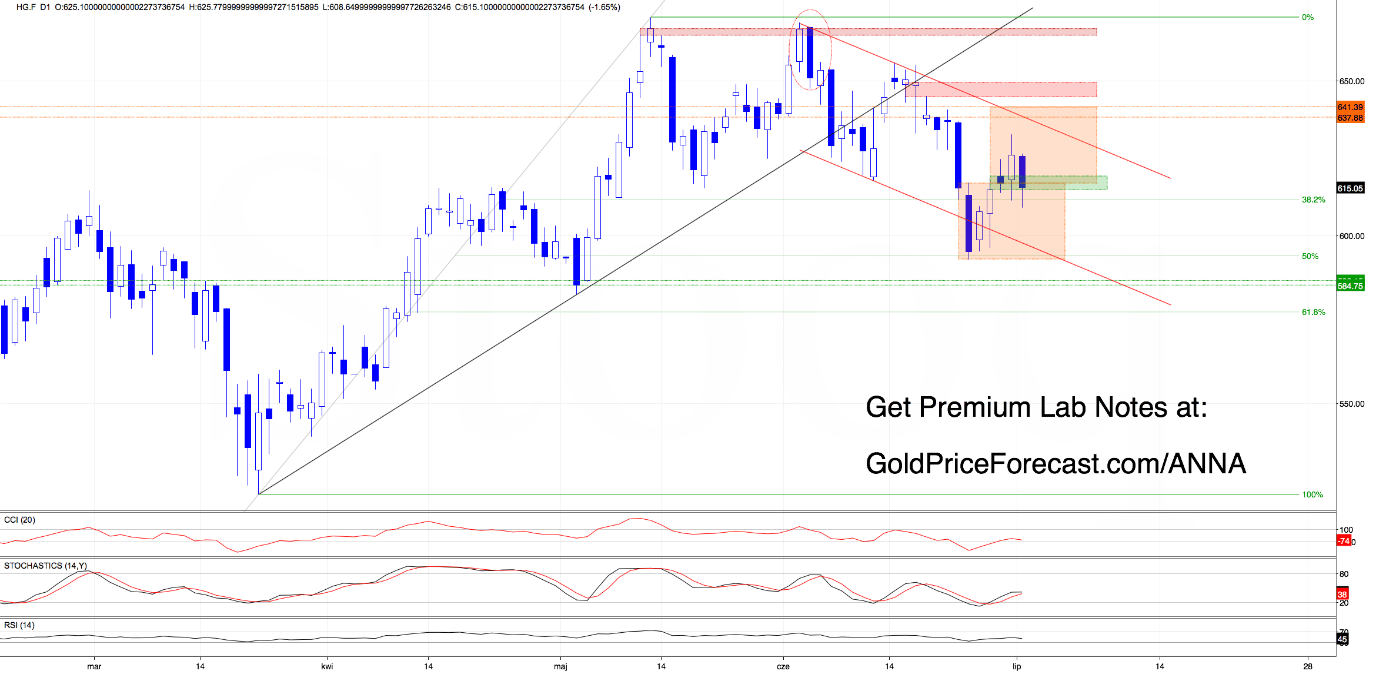
Looking at today's chart, we can see that despite several recent attempts by sellers to regain control, buyers continue defending daily closes above the upper boundary of the previously broken orange consolidation.
That's an encouraging technical development.
Therefore, our Monday outlook remains fully intact.
As we mentioned earlier this week:
“(…) buyers not only closed Friday above last week's bearish gap (612.55-614.80), but also finished the session above the upper boundary of the orange consolidation around 616.50 (positive technical developments).
(…) A successful close above that zone would strengthen the bullish case considerably and shift attention toward the upper boundary of the red descending channel near 641.(…)”
In other words, very little has changed.
As long as the market continues respecting Monday's breakout, buyers remain in control. Nevertheless, a daily close below 616.50 would invalidate Friday's breakout and significantly weaken the current bullish outlook.
Daily takeaway
• Watch 616.50 closely.
• As long as price remains above that level, the bullish scenario stays in play.
• Next upside target is the upper boundary of the red descending channel.
• Daily close below 616.50 invalidates Friday's breakout and shifts momentum back toward the bears.
Zooming out
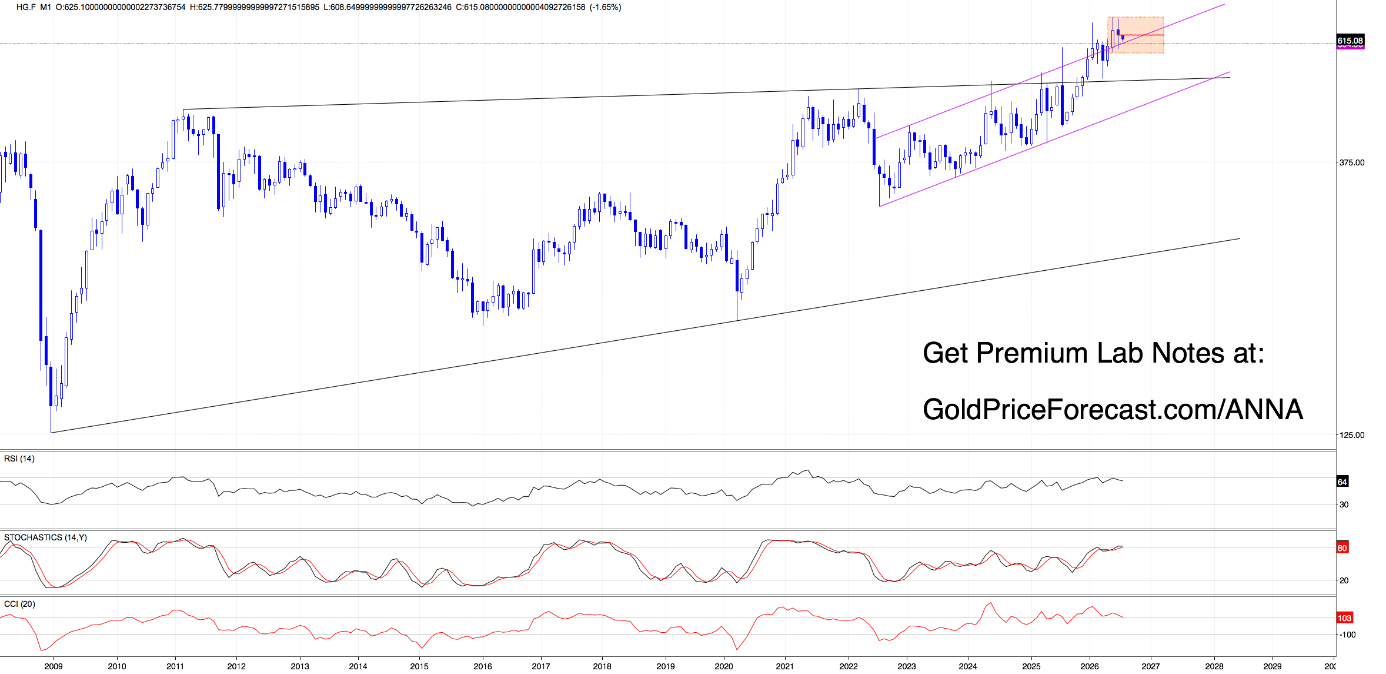
Unlike the other industrial and precious metals, we've covered today, copper continues telling a much more constructive story.
From the monthly perspective, price remains comfortably inside the orange consolidation while holding above the previously broken upper boundary of the pink rising channel.
Yes, July began with a small bearish gap between 625.10-625.40. However, as long as copper continues trading above the upper boundary of the former pink channel - currently located near 605 - buyers retain a solid technical foundation for extending the recovery over the coming weeks.
In our opinion, that support gives bulls enough room not only to challenge the upper boundary of the red declining channel visible on the daily chart, but potentially the upper boundary of the orange consolidation near 671.60 as well.
The long-term trend hasn't changed.
Long-term takeaway
• Copper continues trading above the upper boundary of the former pink rising channel.
• The 605 area remains the first long-term support for buyers.
• As long as that level holds, the broader recovery remains intact.
• The next long-term upside targets are the upper boundary of the red declining channel, followed by the upper boundary of the orange consolidation near 671.60.
• The monthly chart continues supporting the current bullish outlook.
Final thought
One thing stood out across almost every market we analyzed today…
Not direction. Not momentum. Not even volatility.
Confirmation.
Several markets are showing early signs that buyers are trying to regain control. Others continue favoring sellers. But almost every chart is telling the same story: the next meaningful move still depends on confirmation.
That's one of the biggest lessons in trading. A market can look bullish without becoming bullish. It can look bearish without starting a new downtrend. Price often hints at what's coming long before it actually confirms it.
That's why professional traders get paid for waiting.
This week, patience may once again become your biggest edge. Trade what the market confirms... not what you hope it will do.
Stay patient. Stay flexible. And let the market earn your conviction before it earns your capital.
Have a great trading day!
Want free follow-ups to the above article and details not available to 99%+ investors? Sign up to our free newsletter today!
Author

Anna Radomska
Gold Price Forecast
Anna's passion for drawing evolved into a fascination with colorful lines and shapes, which later inspired her interest in the stock market.


