Wheat Futures (ZW #F) forecasting the rally

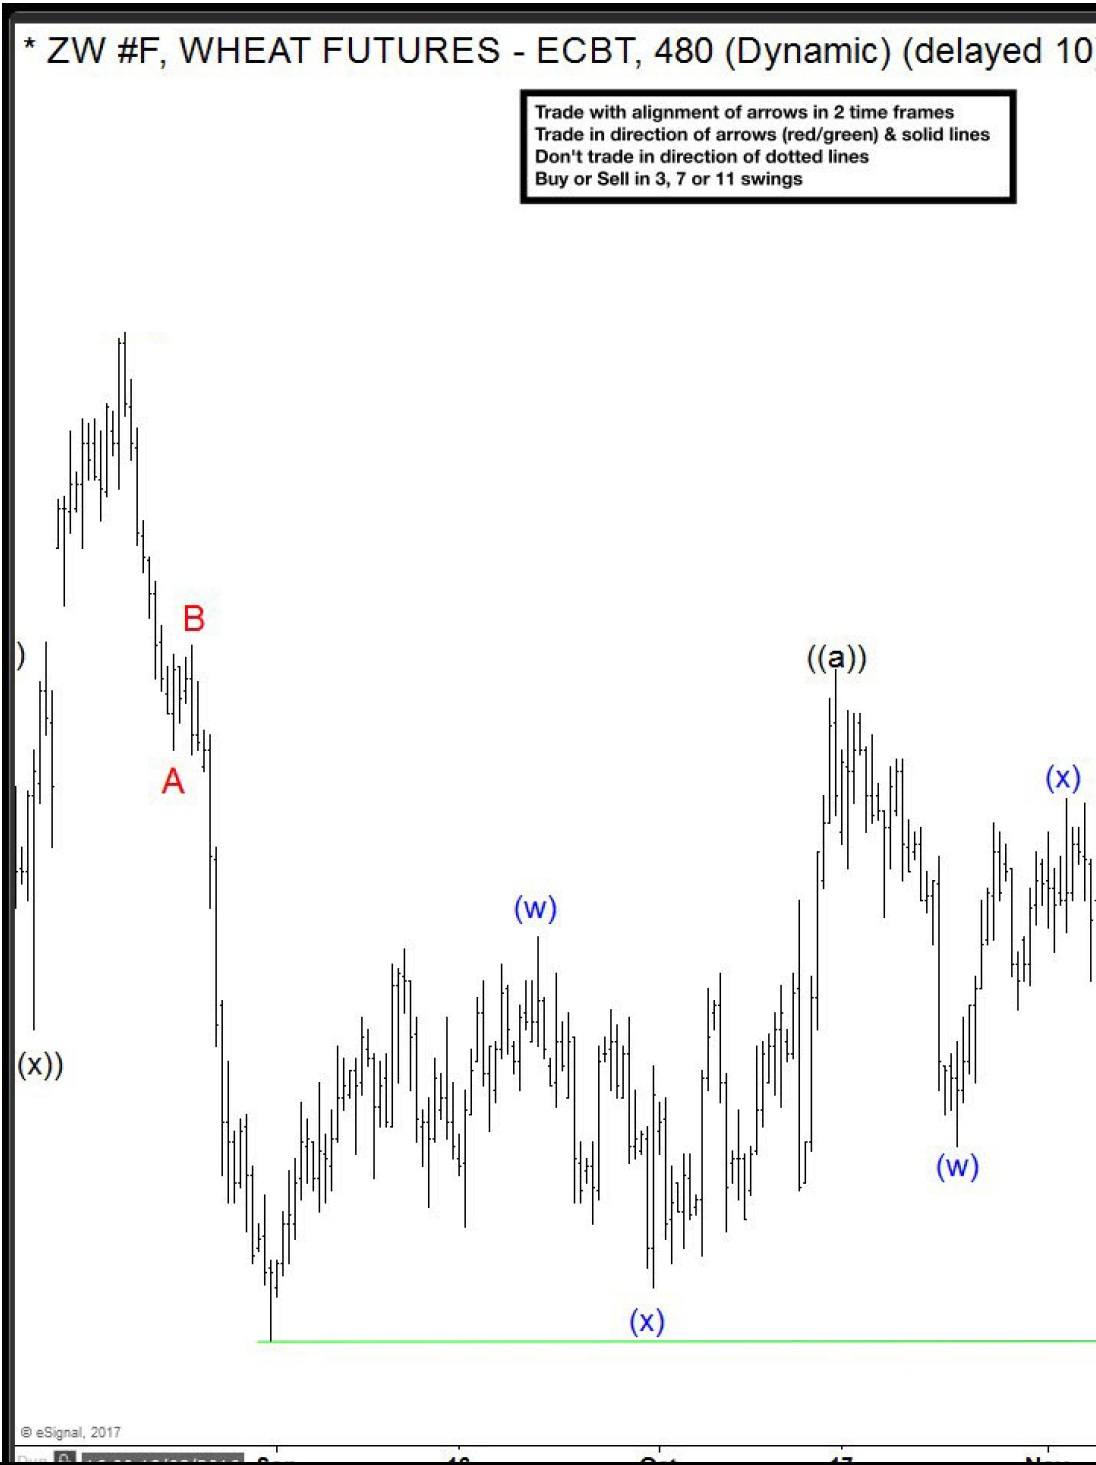
The chart below is ZW #F h4 update from 2.6.2017. Price structure is showing incomplete bullish sequences in the cycle from the 01/12 ( red 2) low. As of right now we can count 5 swings from the mentioned level. Fifth swing ended at 437'4 high and 6th swing is about to complete. It's Marked on the chart as wave ((b)). Once the proposed ((b)) pull back completes, another swing up should ideally follow to complete 7 swings at 446'1+ area. As our members already know, market moves in 3-7-11 swings sequences and this kind of structures in most cases give us the clear path.
Wheat ZW#F 4 Hour chart 2.6.2017
Now , when we got 4h trend , let's take a look at the short term structures and see how we found the reversal area.
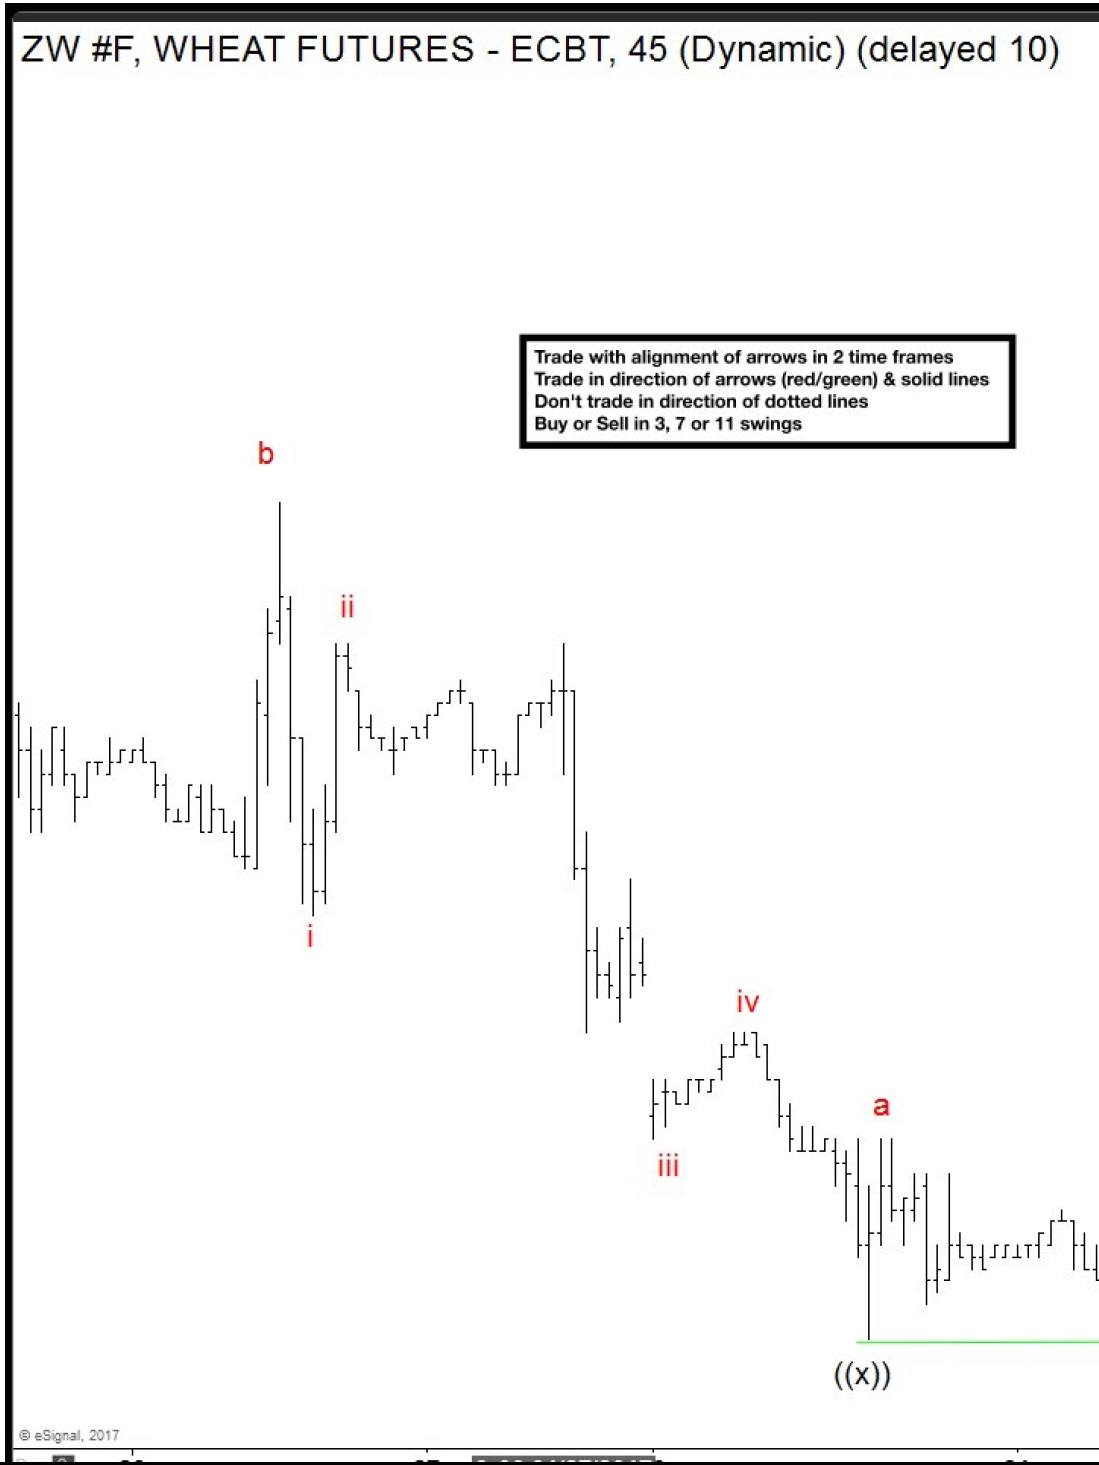
Wheat ZW#F 1 Hour chart 2.7.2017
The price is correcting the cycle from the 412'6 low. Pull back is having form of double three elliott wave pattern. It has reached the inner equal legs (w)-(x) at 422'2 area , with potential to make another marginal push down toward 1.236 fibs at 419'7. Besides incomplete bullish sequences from the 01/12 low, we also have clear 5 wave rally from the 412'6 low that are followed by double three pull back. This structure also suggests that further rally should ideally happen in new 5 waves to the upside.
Reversal area comes at 422'2-419'7. We advised our members to avoid selling the instrument, favoring another leg up due to a 5 swings we have in h4, and 5 waves in h1 time frame.
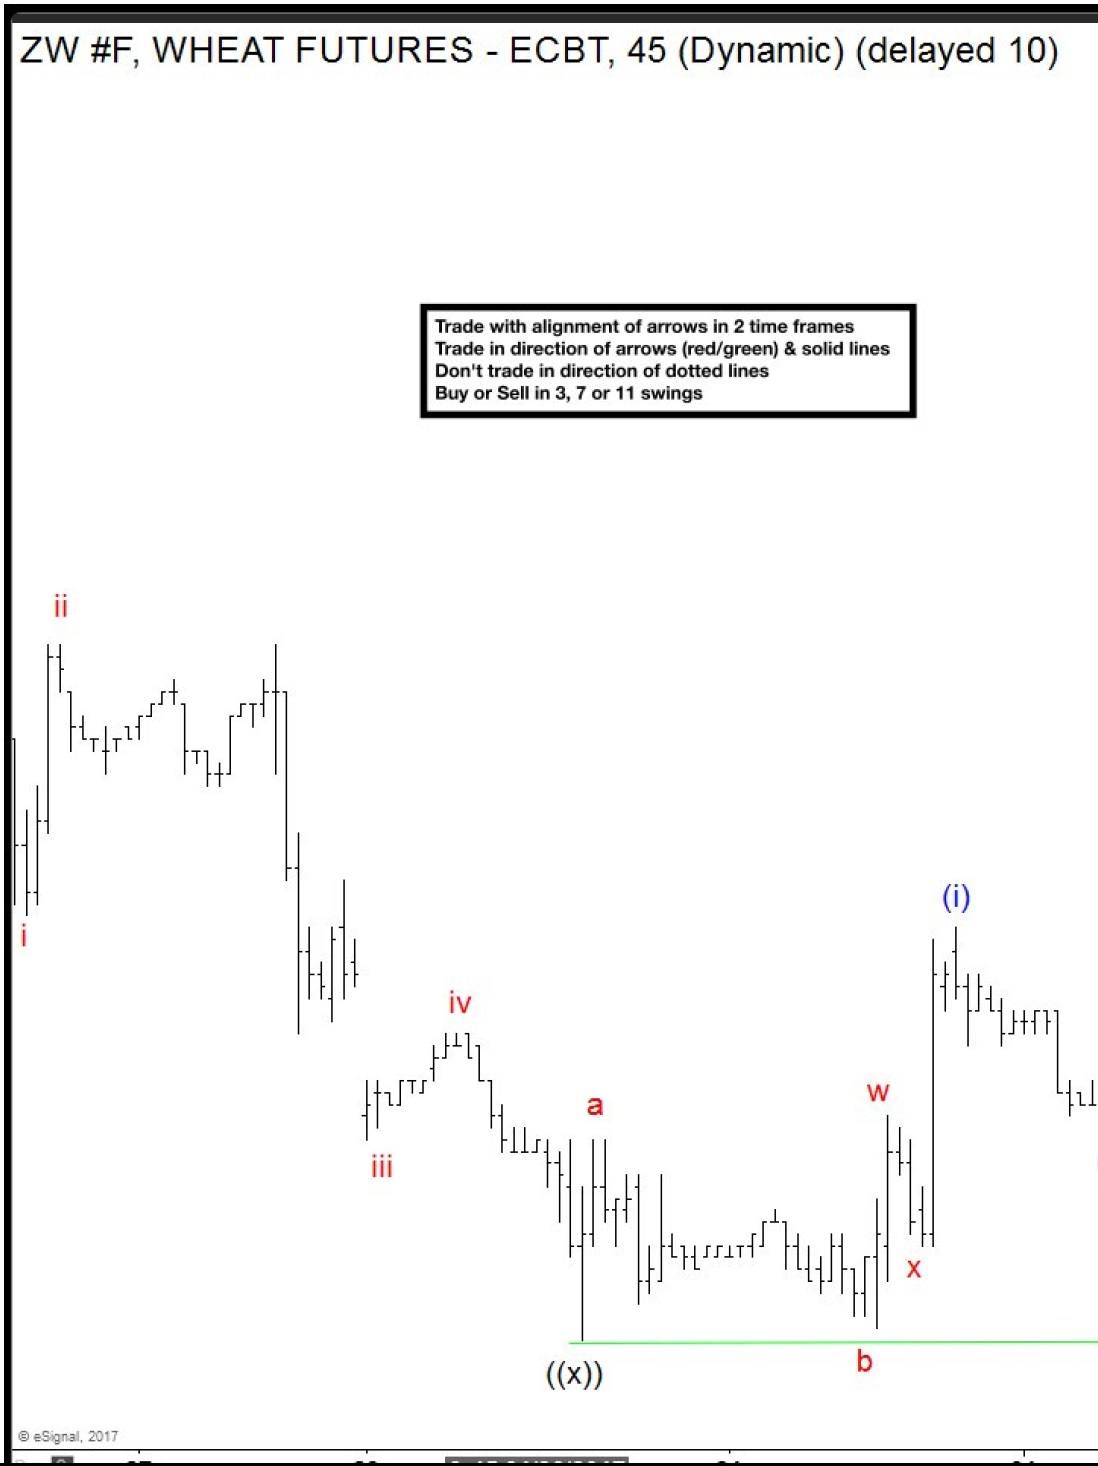
Wheat ZW #F h1 chart 2.8.2017
Eventually Wheat Futures found buyers at mentioned equal legs :422'2-419'7 area, as we expected. The price completed ((b)) pull back right at the 1.236 fibs extension at 419.7 low and made decent reaction from there there. Currently the price is reaching short term equal legs from the 419'7 low @ 431'2-433'0 that can provide short term pull back before rally ideally resumes toward new highs above ((a)) peak. Members who bought the instrument at the equal legs are now enjoying profits within positions that are already risk free.
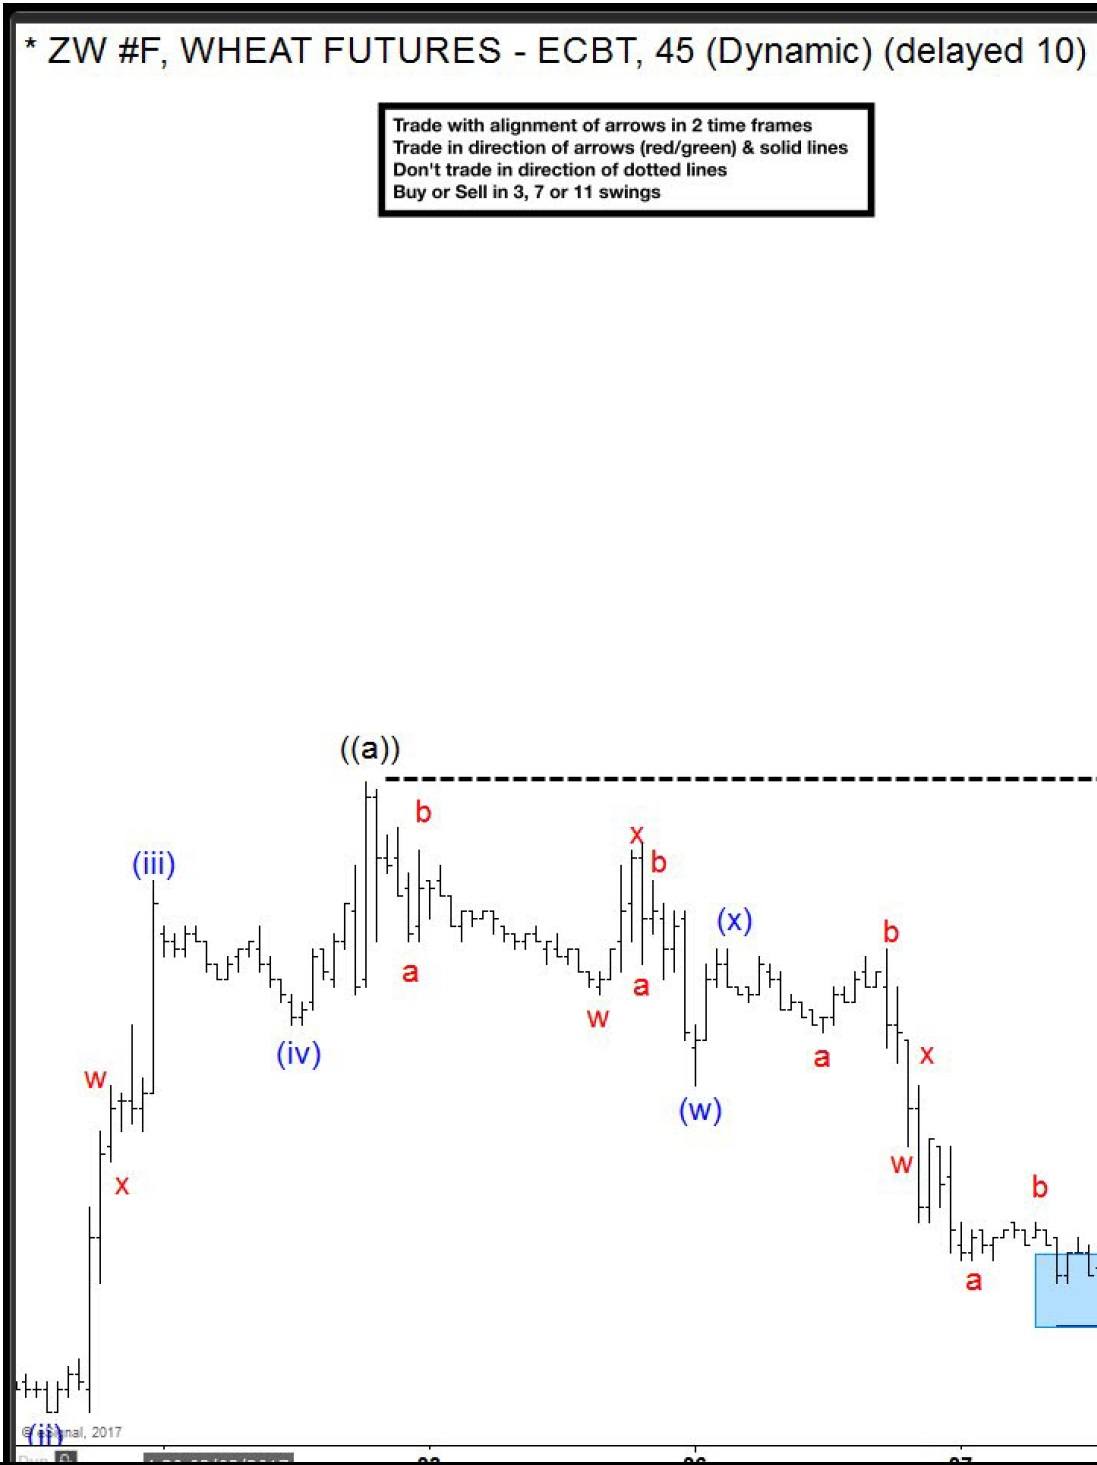
Wheat ZW #F h1 chart 2.14.2017
419'7 low held nicely during the proposed pull back and we got further rally in 5 waves rally. Wheat futures eventualy broke above ((a)) peak as expected.
Note: Some labels have been removed in order to protect client's privileges. Keep in mind that market is dynamic and the view could change in mean time. Success in trading requires proper risk/money management, so does understanding of Elliott Wave theory, Cycle and Correlation analysis . If you're interested in the future path of any of 50 instruments we cover, you can find Elliott Wave analysis in the membership area of EWF.
Become a Successful Trader and Master Elliott Wave like a Pro. Start your Free 14 Day Trial at - Elliott Wave Forecast.
Author

Elliott Wave Forecast Team
ElliottWave-Forecast.com


