What’s driving the Dollar?

After last week’s 12-month high in the dollar index, you might wander who or what cut short the rally. The dollar index has stalled this week and is down some 100 pips from Friday’s high.
Trump puts his oar into the FX market, again
Part of the reason for the decline is the Trump administration. The President and the Treasury Secretary spent the weekend lashing out about the strength of the US dollar, especially in relation to a weakening renminbi. The President has been known to move markets with his musings on Twitter, however the impact is usually short-lived. Instead, we think a more fundamental change could make it harder for the dollar to rally in the near term.
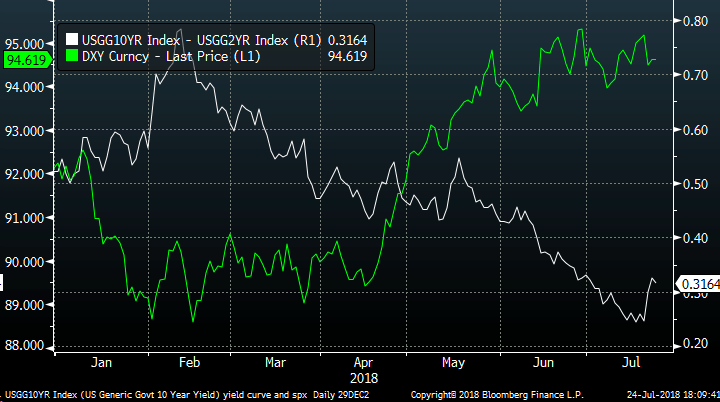
The chart below shows the long-term US Treasury yield minus the short term US Treasury yield, the yield curve. This spread has been narrowing in recent months, as short-term yields rise at a faster pace than longer term yields. This is called an inverted yield curve and suggests that investors are expecting rates to rise in the short term, and for the economy to slow in the medium to longer term requiring rate cuts.
Why this matters for the dollar
This chart pattern shifted earlier this week, with the yield curve widening at its fastest pace in 2 months. This move was driven by a sharp upswing in longer term yields after a report suggested that the BOJ could end its QE programme down the line (for the sensitive bond market this was big news). As you can see in the chart below, the yield curve and the dollar index have an inverse relationship, as the spread narrowed the dollar rose (due to the increase in short term US yields), and when it widened at the start of this week, the dollar fell, as longer term yields rose at a faster pace than shorter term yields.
What the yield curve could signal about US GDP
This shift in the yield curve is happening at an interesting time. The US GDP report is scheduled for release on Friday and the market is expecting a big number of 4.2%, some are expecting an even larger number of 5%, which would be the fastest pace of growth since 2014. The yield curve may suggest a couple of things: 1, there are some in the bond market who believe that the Q2 GDP figures could disappoint expectations on Friday; and 2, that the market is sceptical that the US can keep up this pace of growth, even if we get a decent GDP report on Friday.
Overall, the dollar is likely to remain in focus as we lead up to this GDP report. If the yield curve is reflective of some scepticism of the US GDP hype, then we could see the dollar fall in the coming days and into next week.
Is the White House calling the market’s bluff?
Also, if the White House doesn’t like a strong dollar, then one way to weaken it is to boost expectations of a stronger than expected GDP report only for the report to miss expectations and the dollar to fall. We shall have to wait and see if Trump and co. are calling the market’s bluff.
Author

Kathleen Brooks
XTB UK
Kathleen has nearly 15 years’ experience working with some of the leading retail trading and investment companies in the City of London.


